
Schaeffer Center White Paper Series | DOI: 10.25549/n153-9a66
Policy Context
Rapid growth in Medicare Advantage (MA) has led to almost equal numbers of Medicare beneficiaries in 2023 receiving benefits from MA plans and from traditional fee-for-service (FFS). But MA rates paid to plans are based on spending by FFS beneficiaries, resulting in Medicare overpaying MA plans by 6% ($27 billion) in 2023 alone, according to the Medicare Payment Advisory Commission (MedPAC). Overpayments were due primarily to “coding intensity” ($23 billion) and Star Rating (quality) bonuses. Importantly, the MedPAC overpayment estimate does not include the effects of favorable selection into MA, but favorable selection likely generates a larger magnitude of overpayment.
This paper analyzes the degree of biased selection associated with beneficiaries choosing to switch from FFS to an MA plan by studying MA enrollees in 2020 who switched from FFS during annual open-enrollment periods (which come late in the year) in 2006-2019 and comparing them with those who remained in FFS. Applying the CMS risk adjustment model to the differing diagnoses and demographics of the 402 million FFS beneficiary years in 2006-2019, we found that switchers had substantially lower risk-score-adjusted expenditures in the year that they made the election to switch than beneficiaries who remained in FFS. For each of the 14 years, the odds of switching to MA were consistently higher for FFS beneficiaries with lower risk-score-adjusted expenditures, with the likelihood of switching diminishing as expenditures increase.
The persistent migration of FFS beneficiaries with below-average, risk-score-adjusted expenditures to MA generates overpayments because the capitation amounts paid to MA plans assume these FFS beneficiaries have average expenditures. Focusing on those who switched from FFS to MA plans from 2015 through 2019, we estimate that these distortions in payment rates led to overpayments on the order of 14.4%, with sensitivity analysis suggesting the estimate remains relatively stable under alternative assumptions. This favorable selection into MA makes the current approach of basing MA payments on FFS increasingly problematic and costly to the government, increasing annual overpayments in 2023 from the $27 billion estimated by MedPAC to $75 billion or more. Reform options can attempt to substantially improve the relationship between FFS expenditures and MA payments or delink MA payments from FFS spending, potentially through competitive bidding limited to MA.
Key Takeaways
- Beneficiaries with lower-than-average expenditures than those with similar risk factors were significantly more likely to switch from Fee-for-Service (FFS) to Medicare Advantage (MA).
- As a result, risk-score-adjusted expenditures for the 16.9 million beneficiaries who switched from FFS to MA between 2006–2019 were substantially below average. Plans were overpaid because MA rates are intended for beneficiaries with average—not systematically below average—expenditures.
- MA plans in 2020 were overpaid by 14.4% due to this favorable selection phenomenon; when combined with the 6% overpayment reported by MedPAC for coding intensity and other factors, total MA overpayments were on the order of 20%.
- Basing MA payment benchmarks on FFS expenditures is increasingly problematic as FFS enrollment continues to decline – underscoring the need for reforming how MA payments are set such as by decoupling MA payments from FFS benchmarks or instituting competitive bidding.
A press release covering this white paper’s findings is available here.
Abstract
This study contributes to understanding of how the explosive growth in Medicare Advantage (MA) affects overall federal Medicare spending by comparing expenditures of fee-for-service (FFS) beneficiaries electing to switch to MA at the end of a year with beneficiaries who remain in FFS. Analysis of 2006-2019 data indicate a significantly greater propensity to switch to MA among FFS beneficiaries whose expenditures are low in relation to others with the same risk score. In 2019, beneficiaries with low expenditures compared to their peers (in the first to 15th percentile) were twice as likely to switch to MA as those in the middle (45th to 55th percentile), and beneficiaries above the 85th percentile were less likely to switch than the middle group. Almost half of MA beneficiaries in 2020 had switched from FFS in 2006-2019, and their below-average expenditures generated significant overpayments to MA plans. We estimate that favorable selection led to MA overpayments on the order of 14.4%. Our findings underscore the need for reforming how MA payments are set. Adding our favorable selection estimate to the Medicare Payment Advisory Commission’s 6% estimate of overpayment from differing coding intensity and quality bonuses, overpayments increase to about 20% ($75 billion) of Medicare payments to MA plans.
Introduction
While the Medicare Payment Advisory Commission (MedPAC) and others have estimated that factors such as differences in coding intensity between MA plans and FFS Medicare and easy-to-achieve quality bonuses in MA have led to substantial overpayment to MA plans (MedPAC’s estimate is 6% or $27 billion), we are not aware of any estimates of the effects of favorable selection on MA overpayment.a In this study, we estimate favorable selection by comparing the expenditures of beneficiaries switching to MA with those staying in FFS in 2006-2019. We investigate two questions: (a) What is the relationship between beneficiary expenditures and the odds of switching from FFS Medicare to MA during annual open-enrollment periods and (b) what are the implications for government costs if beneficiaries switching to MA have below-average, risk-score-adjusted expenditures?
After providing background on MA, risk adjustment and the skewed distribution of expenditures, the paper details our methodology and findings that the likelihood of switching to MA increases as beneficiaries’ expenditures decrease and the annual cohorts of switching beneficiaries consistently had below-average, risk-score-adjusted expenditures. We conclude by discussing potential options for reforming the role of FFS expenditures in setting MA payments.
Background on Medicare Advantage
Medicare offers beneficiaries a choice of either participating in traditional fee for service (FFS) or enrolling in private Medicare Advantage (MA) plans. For existing beneficiaries, change is generally restricted to annual open-enrollment periods running from October 15 to December 7, with enrollment in MA starting on January 1 of the next year.b In FFS, the Centers for Medicare and Medicaid Services (CMS) is the insurer, processing claims for services received by FFS beneficiaries and directly reimbursing providers such as hospitals and physicians. In MA, CMS transfers risk to private insurers and pays plans set monthly capitation amounts to finance services utilized by their enrollees, with plans earning profits or losses depending on whether these payments and any enrollee premiums exceed expenditures.c
During a calendar year, CMS pays plans based on their bids, submitted for specific counties in the prior June. The monthly MA rate per beneficiary for a plan combines its bid with other plan characteristics (such as its “Star Rating”) and the benchmark for a county with bidding targets for plans reflecting the expenditures of FFS beneficiaries living in that county. The statute assigns counties to quartiles that increase benchmarks for counties with low average FFS spending and decrease them in counties with high FFS spending.d MA rates (with the 5% bonus) in 2023, generated by combining the variation in average FFS expenditures among states and the District of Columbia at the county level and the quartile system, varied by 220%, ranging from a low of $863.58 in Mora County, New Mexico, to $1,878.96 in Niobrara County, Wyoming.e,1
The expenditures of beneficiaries living in a county and remaining in FFS that provide the basis for MA rates are impacted by biased selection and other distortions, especially if a large share of beneficiaries switch to MA and relatively few remain in FFS. Our order-of-magnitude estimate does not account for the delay when future MA benchmarks reflect increases in average expenditures from having higher spending beneficiaries stay in FFS and the absence of low-spending beneficiaries who switch to MA. Expenditures incurred by MA beneficiaries play no role in setting MA payment rates, although MA beneficiary expenditures in one year can indirectly affect—with a lag of several years—Medicare spending if they influence the future bids of a plan, which are subject to the market discipline of competing with other MA plans as well as with FFS.
Among beneficiaries in April 2023 with both Part A and Part B (a requirement to join MA), 31.2 million (52.6%) participated in private plans versus 28.0 million in FFS, a vast change from 2006, when MA enrollment totaled 1 in 6 (6.6 million) and FFS had 32.4 million beneficiaries. From 2006 to 2023, private plan enrollment grew by 24.6 million (373%) but FFS beneficiaries decreased by 4.3 million
(-13.3%)f. The decline in FFS enrollment left 16.5% of counties in January 2023 with 1,000 or fewer FFS beneficiaries with both Part A and Part B, 49.4% of counties with 3,000 or fewer, and 65.1% of counties with 5,000 or fewer—the minimum risk-pool size established for accountable care organizations.2 Between 2006 (the first year in which MA plans implemented reforms enacted in the Medicare Modernization Act) through 2019 (the last year for which we have detailed claims data unaffected by COVID-related distortions in healthcare spending), 16.9 million FFS beneficiaries switched to MA during annual open-enrollment periods. Notably, 11.3 million of these switchers remained in MA in 2020, comprising 46.9% of private plan enrollment.
Background on Risk Adjustment
Published research findings on risk adjustment do not fully address the relationship between biased selection into MA, MA rates and the highly skewed distribution of FFS expenditures, in part because they preceded rapid MA growth and switching by millions of FFS beneficiaries to MA. Prior research provides conflicting conclusions about the efficacy of CMS’ approach to risk adjustment, which makes use of hierarchical condition categories (HCC) and demographic information. Some research indicates that CMS’ HCC approach considerably reduced the extent to which MA plans enrolled beneficiaries with lower-than-average risk.3,4,5 Other research suggests that MA plans responded strategically to the introduction of the HCC model by selectively enrolling beneficiaries with below-average risk score costs.6 Yet other research examining HCC risk adjustment when the system was fully implemented concluded that the amount of selection in 2006-2010 was approximately the same as before the HCC system was implemented.7
CMS uses the expenditures and utilization of FFS beneficiaries to calibrate the increasingly sophisticated versions of its risk-adjustment model, which adjusts MA payments by accounting statistically for expected differences in expenditures associated with specific groups of beneficiaries based on their diagnosed conditions and demographics.g,8 The HCC model incorporates specific diagnoses (e.g., diabetes or congestive heart failure) and/or beneficiary characteristics (e.g., age, gender, institutional status, disability and dual eligibility for Medicaid) to create risk scores that adjust payments to MA plans.
The CMS risk-adjustment model identifies for each beneficiary a risk score and applicable HCCs. HCCs represent clinically meaningful categories but beneficiaries grouped together can have additional HCCs, varying demographic characteristics and different risk scores, as well as differing expenditures. Grouping beneficiaries by risk scores facilitates analyzing the role of expenditures in switching to MA or staying in FFS because variations other than expenditures are statistically controlled when beneficiaries have similar risk scores (which incorporate HCCs and demographics).
MA risk adjustment corrects for group-level differences in expenditures but not those associated with specific individuals, as CMS explained in a 2021 Report to Congress:
At the individual level, predicted medical expenditures can be lower or higher than actual medical costs, but at the group level, below-average predicted costs balance out above-average predicted costs.9
Only neutral selection avoids changing average expenditures at the group level, maintaining the balance between below- and above-average expenditures. As detailed later, the switching to MA by 16.9 million beneficiaries in 2006-2019 demonstrated a consistent pattern of biased selection with below-average, risk-score-adjusted expenditures in each annual cohort changing the FFS population and increasing both FFS average expenditures and MA rates.10
Highly Skewed Distribution of Expenditures and Risk Adjustment
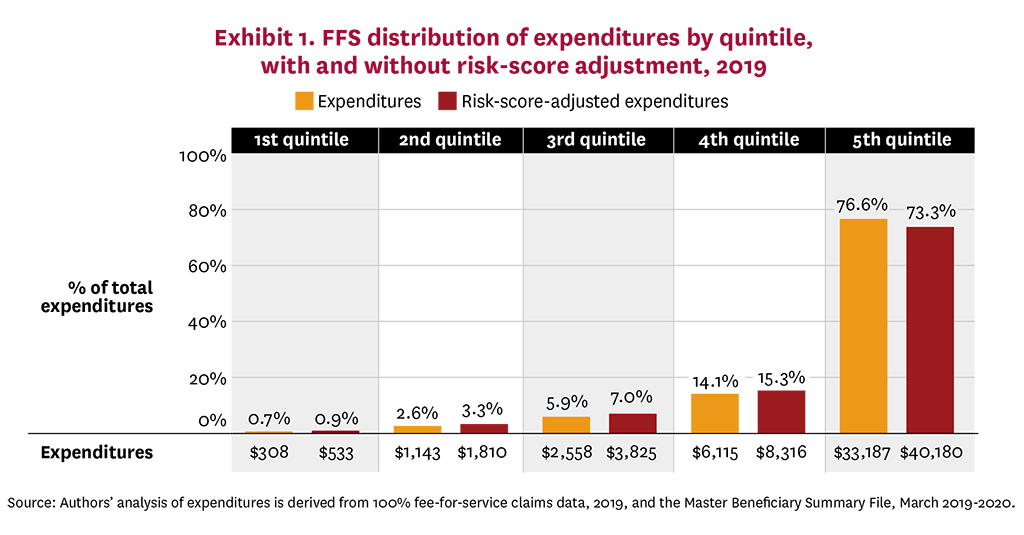
A highly skewed distribution of health spending magnifies the financial effects of favorable selection if a disproportionately large share of the 16.9 million FFS beneficiaries who switched to MA in 2006-2019 have significantly below-average expenditures (or if disproportionately few have significantly above-average expenditures). Having 2019 mean expenditures of $8,663 exceed by 347% the median of $2,494 illustrates the skewed distribution of FFS expenditures, a conclusion amplified by comparing expenditures of beneficiaries in the lowest and highest quintiles—averages of $308 versus $33,187 and 0.7% versus 76.6% of total spending. Converting 2019 FFS beneficiary expenditures to risk-score-adjusted expenditures does not materially alter the highly skewed distribution: The mean risk-score-adjusted expenditure of $11,439 exceeded by 427% the median of $3,742; beneficiaries in the lowest quintile averaged $533 and 0.9% of total spending compared to expenditures of beneficiaries in the highest quintile averaging $40,180 and 73.3% of total spending. On both a nominal and risk-score-adjusted basis, Exhibit 1 displays for each quintile the average and share of total 2019 FFS spending. The distribution of risk-score-adjusted expenditures by quintiles remains similar when 2019 risk scores are disaggregated into low-risk, medium-risk and high-risk categories (Appendix Exhibit A1).
Study Data and Methods
We used logistic regressions to estimate the odds of switching to MA based on risk-score-adjusted spending and analyzed descriptive statistics comparing the risk-score-adjusted expenditures of FFS beneficiaries switching to MA and staying in FFS. We also used our results regarding risk-score-adjusted expenditures to approximate CMS overpayments to MA from favorable selection in 2020. The next two paragraphs explain risk-score-adjusted expenditures, which refers to the relationship of a beneficiary’s expenditures to the mean for all beneficiaries with the same risk score in a year.
We computed risk scores for each beneficiary for each year using the most current risk-adjustment model with CMS-provided software that accepts both ICD-9 and ICD-10 as input diagnostic codes (2016 v21 HCC).h With an annual average of 28.7 million FFS beneficiaries, we assigned beneficiaries in each year to 183 risk-score cells, grouping into separate cells risk scores below 1.0 that had the same single-digit decimal (e.g., 0.7), risk scores greater than one and less than 10 based on having the same two digits (e.g., 1.7), and risk scores greater than 10 into cells based on having the same three digits (e.g., 10.7). For ease of exposition, we refer to beneficiaries assigned to each of these risk-score cells as having the same risk score.
For each year for each risk-score cell, we constructed expenditure percentiles to measure spending variation. Arraying expenditures from lowest to highest among beneficiaries with the same risk score in a year, we mapped expenditures to percentiles, assigned beneficiaries to percentiles based on their expenditures and calculated the average (mean) expenditure for each percentile. We generated the ratio of spending in each percentile to the mean for that risk score by dividing the average amount for each percentile by the risk-score mean, repeating the process of assigning ratios to percentiles for each risk score.
The migration of switchers with below-average, risk-score-adjusted expenditures overpays MA in two ways. First, CMS pays MA plans capitation calibrated for beneficiaries with average (mean) risk-score-adjusted expenditures despite switchers consistently having below-average expenditures. To the extent switchers’ lower risk-score-adjusted expenditures persist over time, the migration of successive cohorts to MA increases the number of switchers with below-average, risk-score-adjusted expenditures for whom plans are being paid average rates. Second, favorable selection increases the rates paid to plans for all MA enrollees by overstating average FFS expenditures, which result from including expenditures of more expensive stayers but excluding those of less expensive switchers.
Study Sample: The 100% Medicare Master Beneficiary Summary Files, accessed through the CMS Virtual Research Data Center, constituted our primary source of enrollment, demographic, diagnostic and expenditure data for 2006-2019. Beneficiaries in the 50 states and the District of Columbia who participated in both Part A and Part B generated 402 million beneficiary-year observations, with beneficiaries classified as either FFS or MA based on their enrollment status in March of each year. FFS beneficiaries ineligible for MA (because they lacked both Part A and Part B) or who died during the year (because most deaths would have occurred before the annual mid-October to December open-enrollment period) were excluded from our analysis. After linking enrollment and expenditure data, we standardized each year’s expenditures to 2019 by updating nominal year dollars by the annual changes in Medicare average expenditures per beneficiary.i
Measures: We analyzed FFS beneficiary propensity to switch to MA using a binary indicator variable, with one for electing to enroll in an MA plan in the annual October to December open-enrollment period or zero when remaining in FFS. Our primary independent variable of interest is beneficiaries’ risk-score-adjusted expenditures in that year.j After assigning expenditure percentiles to FFS beneficiaries for each risk score for each year, we placed each beneficiary in one of seven categories reflecting whether their expenditures were below the 15th percentile, between the 15th and 30th percentile, between the 30th and 45th percentile, between the 45th and 55th percentile (the median category), between the 55th and 70th percentile, between the 70th and 85th percentile, or above the 85th percentile.
MA Overpayments from Favorable Selection: Favorable selection generates overpayments from paying average MA rates for switchers with below-average expenditures and paying overstated rates to plans for all MA. We computed overpayments from favorable selection as a percentage of base-case 2020 payments to MA plans and in 2020 dollars. After separately computing each source of overpayments, we combined the two components after adjusting for interactions that reduce the total.
As the first step, we computed a base case of total MA payments in 2020, multiplying at the county level the number of MA beneficiaries times the average risk score times the monthly 2020 MA rates times 12, summed nationally. Our $285 billion base case is within 10% of 2020 actual MA expenditures, despite our stylized calculations making important simplifying assumptions, such as using CMS-published MA rates rather than actual rates reflecting plan bids (along with other plan-specific factors) and not incorporating the time lag between when FFS expenditures occur and when they factor into MA rates.k When computing switchers’ expenditures, we also assumed the ratio of each expenditure percentile to the mean, derived from national data, applies at the county level.
We computed overpayments from paying MA rates appropriate for beneficiaries with average risk-score-adjusted expenditures for switchers with below-average, risk-score-adjusted expenditures in three steps. First, we computed annual payments to MA plans for all switchers by multiplying the monthly MA rates in their counties of residence times their risk scores times 12. Second, we computed the expected spending of switchers based on their expenditure percentiles—the ratios of beneficiaries’ expenditure to the means for their risk scores—times the monthly 2020 MA rates in their counties of residence times 12, summed nationally. Third, we subtracted the expected expenditures for switchers (if they had remained in FFS) from the revenue paid to MA plans for them.
We computed overpayments from paying MA rates overstated by no longer factoring into FFS the below-average expenditures of switchers. After computing FFS average expenditures for both switchers and stayers, we calculated the percentage by which the FFS average for stayers exceeds the average for all FFS beneficiaries. We multiplied the percentage by which the average for stayers exceeds the average for all beneficiaries times the national base case of total MA payments to generate the associated overpayment.
Since many who switch to MA remain in the program for many years, the decision to switch will affect Medicare spending for multiple years. So, in addition to calculating how their first year in MA affects Medicare spending, we calculated up to five years of potential impact from switching. But calculating these multiyear impacts involves grappling with the phenomenon of “regression to the mean,” a statistical tendency for those whose spending is above or below a population mean in one year to be closer to the mean in subsequent years.
We explored how many annual cohorts of switchers to include when estimating overpayments and how to adjust the risk-score-adjusted expenditures of switchers over time. While generally observing little difference in our logistic regressions when we substituted an earlier year’s spending to predict expenditures of in the year of switching, we felt that it would be an appropriately conservative approach to use a range of assumptions about the magnitude of regression to the mean. We annually reduced the gap between the mean and switchers’ expenditures to 85% of the previous year’s gap and only included the five most recent cohorts of switchers, assuming the expenditures of earlier cohorts of switchers had fully regressed to the mean. These assumptions included only overpayments associated with
7.1 million 2020 MA enrollees who had switched from FFS in the 2015-2019 cohorts, excluding any overpayments associated with the 4.2 million switchers from the 2006-2014 cohorts also enrolled in MA in 2020 and the 5.6 million switchers to MA in 2006-2019 who were not enrolled in 2020.
In 2020, the risk-score-adjusted gap between the mean and expenditures of 2019 switchers would be 85% of the gap in 2019, while the gap in 2020 between the mean and expenditures of 2015 switchers would be 37.7%. Choosing a more rapid regression to the mean factor—multiplying the previous year’s difference by 75%—generated a relatively modest decrease in the estimate even though the gap in 2020 between the mean and expenditures for 2015 switchers would fall by 19.9 percentage points to 17.8%.
Statistical Analysis: First, we generated descriptive statistics on the key characteristics of switchers and stayers for each year in 2006-2019, which consistently showed that the risk-score-adjusted expenditures of switchers were substantially below those of stayers. Next, we estimated a logistic regression model with fixed effects for each year, while also exploring a second model with a covariate control for county-level MA penetration.
Limitations: CMS files contain extensive data on FFS expenditures and utilization, but lack comparable data on MA, which precludes directly comparing risk-score-adjusted expenditures of beneficiaries in FFS with those in MA. Despite recent progress after years of CMS prodding MA plans to improve reporting, MA encounter data are not yet comparable to FFS claims data, do not reliably capture all services provided, and reflect differences in reporting diagnoses and resulting risk scores. In its June 2019 Report to Congress, MedPAC explained the substantial usefulness that complete encounter data would have and recommended a series of strong actions to achieve it. These included stricter penalties for plans with poor performance in accurately reporting encounter data, implementing a payment withhold to introduce a direct financial incentive for plans to submit complete and accurate data, and requiring direct submission of providers’ claims to Medicare Administrative Contractors.11 Accordingly, we did not investigate the expenditures of beneficiaries who switched from MA to FFS; however, published studies report that higher-cost MA patients have an above-average rate of disenrolling from plans, suggesting another potential source of biased selection.12, 13, 14
Focusing on when beneficiaries elect to switch to MA permits comparing their risk-score-adjusted FFS expenditures with those of stayers in that year as well as in prior years, but raises the question of how well switchers’ FFS expenditures predict subsequent years’ expenditures had they remained in FFS. A beneficiary with either a significantly above- or below-average expenditure in one year is statistically likely over time to become less of an outlier. However, it is unclear how the general phenomenon of beneficiary expenditures regressing to the mean applies to risk-score-adjusted expenditures and, more specifically, changes in expenditure percentiles. As detailed later, we computed multiyear effects based on the experience of 2019 switchers in combination with their change in risk-score-adjusted expenditures over time, adopting regression to the mean factors after exploring several alternative approaches.
Our analysis did not include investigating what motivates beneficiaries with lower risk-score-adjusted expenditures to be more likely to switch to MA. We do not have insight into the role of either beneficiaries’ assessments that MA would work better for them (adverse selection) or MA plan actions such as marketing, network composition, or designing benefits, cost-sharing and formularies (preferred-risk selection). Similarly, we did not study beneficiary switching among plans or from plans to FFS, newly eligible beneficiaries who bypassed FFS when joining MA, plan exit,15,16,17 or the extent and cost implications of coding differences.18, 19
Study Results
Each annual cohort of beneficiaries electing to switch to MA during open enrollment had below-average, risk-score-adjusted expenditures. Of the 29.0 million FFS beneficiaries in 2019, 1.7 million (6.0%) switched to an MA plan. Without risk-score adjustment, expenditures for all FFS beneficiaries in 2019 averaged $8,663, but switchers had expenditures of $6,631, compared to $8,793 for stayers. With risk-score adjustment, 2019 expenditures for all FFS beneficiaries averaged $11,439, but switchers had expenditures of $9,094, compared to $11,589 for stayers. Removing the expenditures of switchers results in average risk-score-adjusted expenditures of stayers 1.3% higher than a risk pool that included both stayers and switchers. As detailed in Appendix Exhibit A2, 2006 and 2012 had similar results.
Beneficiaries with low risk-score-adjusted expenditures were more likely to switch relative to median-expenditure beneficiaries, while beneficiaries with high risk-score-adjusted expenditures were less likely to switch (Exhibit 2). FFS beneficiaries assigned to the least expensive grouping of risk-score-adjusted expenditures were twice as likely to switch to an MA plan compared to the median group of beneficiaries (those with expenditures falling between the 45th and 55th percentiles). Relative to the median group (in the 45th to 55th percentiles), the likelihood of switching diminished as the category reflecting risk-score-adjusted expenditures increased (significant at the 1% level).
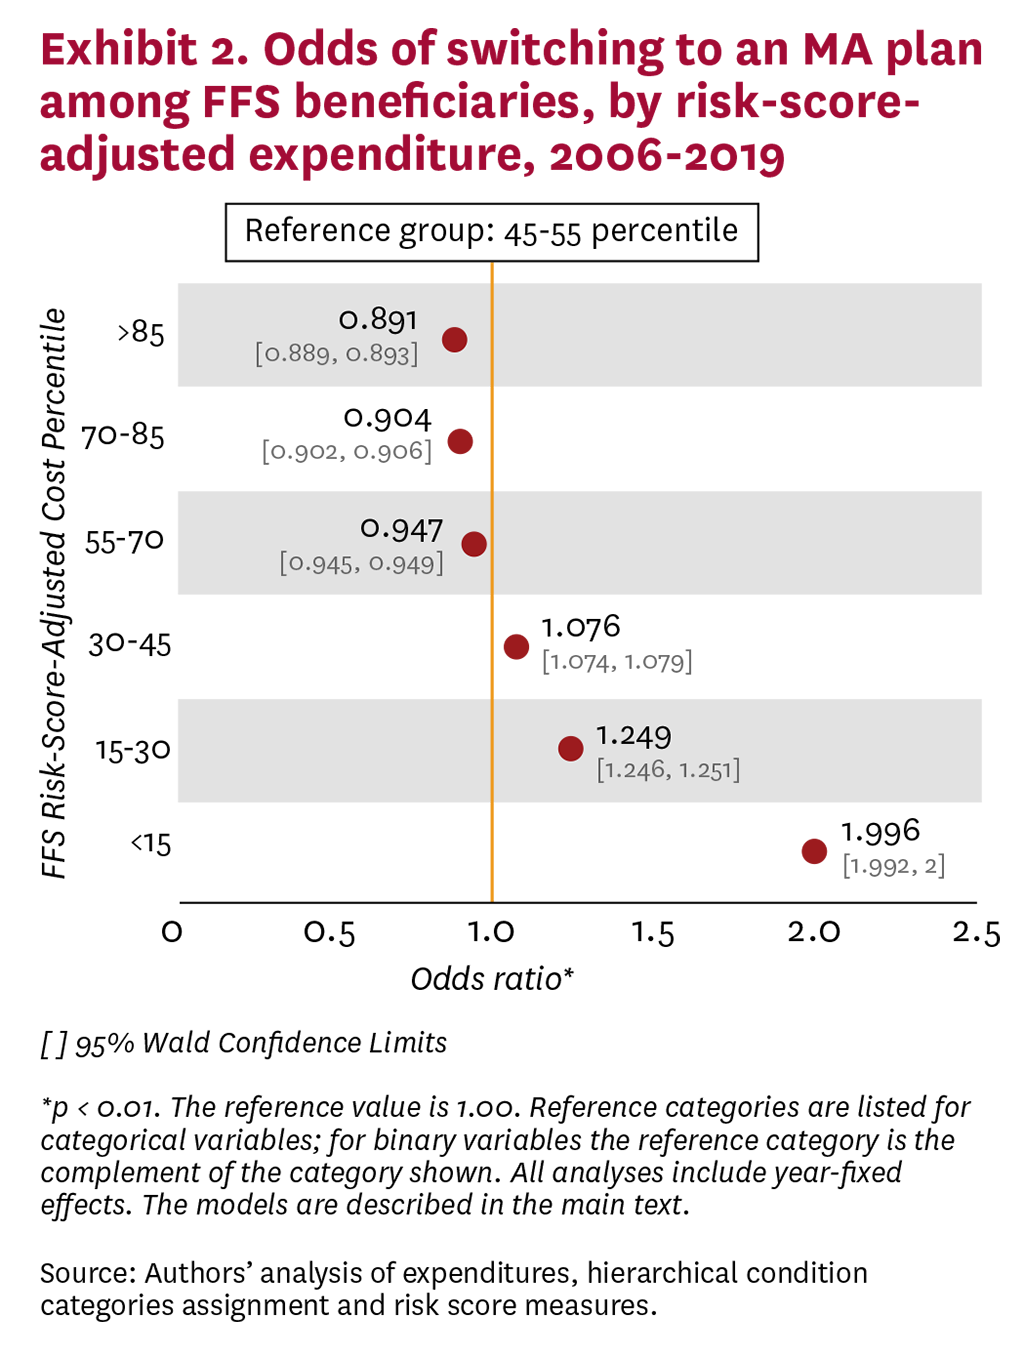
To investigate the influence of MA penetration on switching to MA, we constructed an alternative logistic regression model that interacted county MA penetration with the regression underlying Exhibit 2. The results show that the odds of switching to MA increase with county MA penetration (Appendix Exhibit A3), which implies that the substantial amount of switching seen in recent years is likely to continue. Interactions between the groupings of beneficiaries by percentile range and county MA penetration did not show appreciable differences in the odds of switching.
To assess risk-score-adjusted FFS expenditures over time as a proxy for switching to MA, we first re-estimated the regression underlying Exhibit 2 using only 2019 FFS beneficiaries to estimate the probabilities of switching to an MA plan. Comparing the results from regressions using 2006-2019 and 2019-only data shows higher odds of switching in 2019, but a similar pattern (Exhibit 3). The probabilities of switching remained quite similar when the 2006-2009, 2010-2014 and 2015-2019 cohorts were modeled separately.

Exhibits 4 and 5 detail the results of our overpayment analysis. To help explain our methodology, Exhibit 4 presents a simplified single-year approach that assumes no change in risk-score-adjusted expenditures between 2019 and 2020. Exhibit 5 incorporates the effects of the 2015-2019 annual cohorts of switchers, with expenditures progressively regressing to the mean over time, which lessens the amount by which risk-score-adjusted expenditures vary from average. The four panels in each exhibit present similar information and the national base case of MA payments (Panel A) is the same in both exhibits. Panel B displays the revenue paid to MA plans in 2020 for switchers (which is a subset of the national base case revenue) and the projected expenditures of switchers; the difference between switcher revenue and switcher expenditures is the amount of overpayment from paying average rates for switchers with expected below-average expenditures. Panel C shows the overpayment from recalculating MA rates to include the expenditures of both stayers and switchers, presenting the average risk-score-adjusted expenditures for all FFS beneficiaries by to reflect both FFS stayers and FFS switchers. Panel D combines into a single estimate the increased government cost resulting from paying average capitation for switchers with below-average expenditures and overstated rates for all MA enrollees, after adjusting for the interaction that somewhat reduces the amount by which rates are overstated. Amounts are expressed both in dollars and as a percent of the national base-case amount.
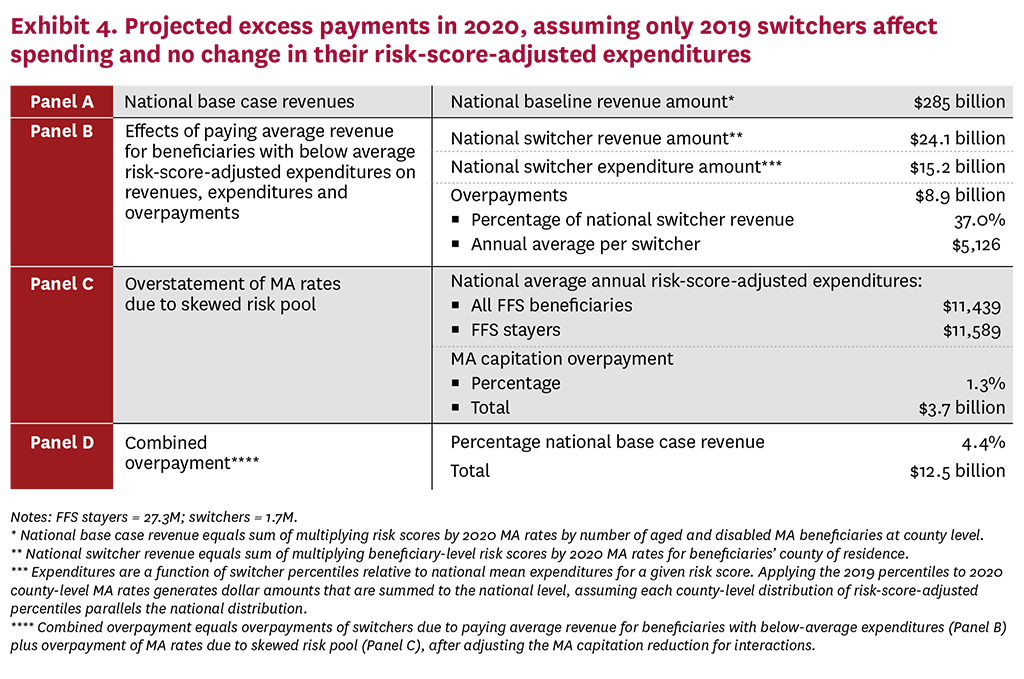
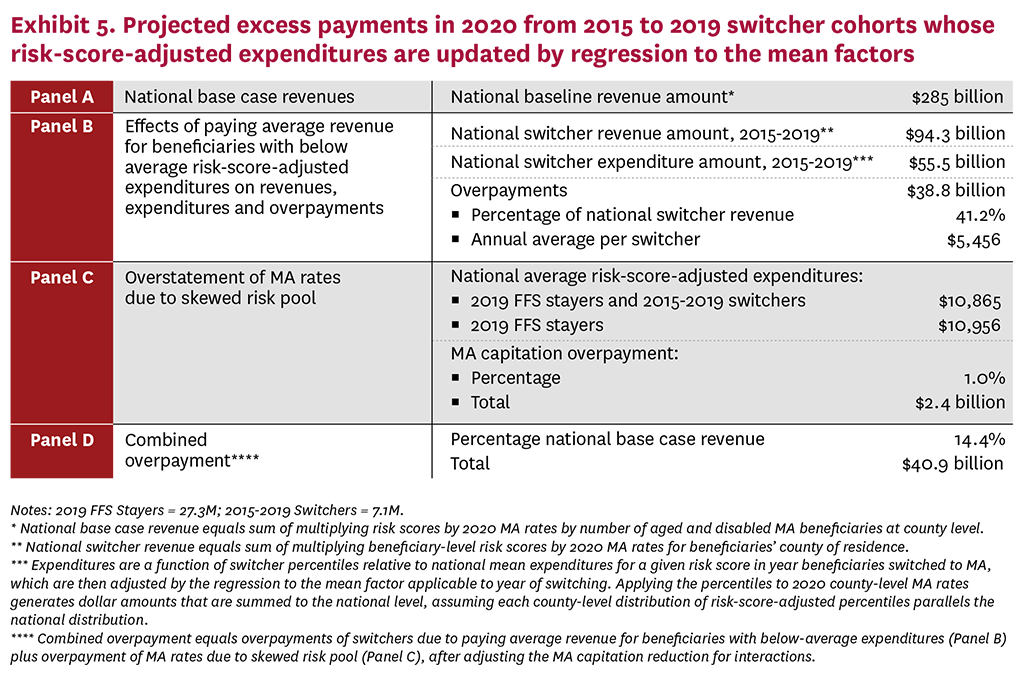
We estimate that national base-case revenue paid to MA plans in 2020 totals $285 billion, which benchmarks reasonably well to actual 2020 MA expenditures reported by the CMS actuary. Under our stylized approach to approximating MA overpayments—which includes only the 2015-2019 cohorts of switchers and assumes risk-score-adjusted expenditures progressively regress to the mean—the combined overpayment from favorable selection is 14.4% of MA revenue. Expressed in dollars, MA favorable selection approximates $40.9 billion in 2020, which would grow to $59.3 billion in 2023 if increased by the ratio of MA spending in 2023 to 2020.
Disaggregating the sources of overpayment, the larger component—$38.9 billion—arises from paying average 2020 MA rates for switchers with below-average, risk-score-adjusted expenditures. Regression to the mean lowers average overpayments per switcher for earlier cohorts, but the increased number of switchers increases total overpayments. The overpayment amounts to 41.2% of plan revenues for switchers, for an average overpayment per switcher of $5,456 in 2020. Overpayments from overstated MA rates based on skewed average FFS expenditures total $2.4 billion in 2020, or 1.0% of national base-case revenue.
Discussion and Conclusions
Our analysis showed substantial differences in risk-score-adjusted expenditures between those who switched to MA and those remaining in FFS. Results were consistent over the 14 years studied. This persistent effect pays average MA rates for millions of beneficiaries with below-average, risk-score-adjusted expenditures, and overstated per-beneficiary FFS expenditures translate into higher county benchmarks and MA rates. Studies have shown that higher MA rates result in higher plan profit margins along with enrollees receiving additional extra benefits.20
Despite Medicare beneficiaries with both Part A and Part B increasing by 20.3 million—from 39.0 million in 2006 to 59.3 million in April 2023—the number in FFS declined by 4.3 million (-13.3%), falling from 32.4 million in 2006 to 28.1 million in April 2023. Basing MA payment rates on FFS expenditure becomes more problematic as FFS beneficiaries with both Part A and Part B are a shrinking minority (47.4%), and their spending becomes increasingly skewed by the selection process outlined in this paper. The differentials in diagnostic coding in MA versus FFS compound concerns about using FFS to set MA rates, in part because CMS’ current 5.9% reduction to MA rates is substantially below the 9.5% reduction recommended by MedPAC, with academic literature suggesting even larger coding adjustments.21
Identifying substantial favorable selection into MA does not shed light on the factors behind it. Favorable selection could be driven mostly by individual beneficiaries choosing which model is most suited to them given their preferences and medical conditions. Or it could be driven mostly by actions by plans, some of which are designed to improve care, that attract relatively low-spending enrollees. FFS beneficiaries with chronic conditions being actively treated and using a substantial amount of specialized care may be reluctant to switch to MA and change from unrestricted provider networks or to incur more aggressive use of utilization management tools, such as prior authorization. Health plans’ substantial investment in primary care, intended to improve care and member satisfaction, as well as save money, may be more appealing to relatively healthy beneficiaries than to those accustomed to needing care from many subspecialists.
Policies to improve the accuracy of MA rate setting can follow two fundamentally different directions. One strategy would pursue proposals to reform the current administered payment approach, either by setting MA rates without regard to their relationship to FFS or by assuring equity between FFS and MA. For example, overpayments from aggressive coding by plans could be significantly diminished, such as by increasing the statutory minimum for the across-the-board reduction that CMS applies to all MA plans, eliminating the influence of codes with little connection to treatment, or precluding plans from incorporating into risk adjustment codes generated by health risk assessments or during annual physicals.22 Over time, MA rates could be updated based on policy and budgetary considerations without regard to FFS.
Maintaining the relationship between FFS and MA would require making MA encounter data comparable to FFS claims data, which would require mandating a major effort by MA plans to markedly improve the accuracy, completeness and comparability of their data, but could help address the selection effects estimated by this study.
Significant obstacles constrain generating MA data comparable to FFS claims data that would permit reliably comparing MA and FFS data to address equity. MA encounter reporting lacks the detailed, lengthy payment-system regulations that govern paying FFS claims and assure the comparability of claims data. Implementing uniform, detailed MA data reporting standards would entail significant behavioral change and investments. The lengthy history of managed care companies having limited success with getting complete and accurate data reporting when encounters are not directly connected to payments illustrates some of these obstacles. The lack of uniform reporting by states of Medicaid expenditure data to CMS may be indicative of challenges associated with imposing uniform coding and reporting requirements on organizations with differing practices, policies and incentives. Differences in coding both between FFS and MA and among MA plans pose similar issues for reliably gaining comparable data on diagnoses, an objective complicated by differences in practice patterns between FFS and managed care such as greater reliance on primary rather than specialist care or substituting enhanced skilled nursing facility care for inpatient hospital care.
A starkly different strategy would abandon administered pricing for setting MA rates in favor of competitive bidding. One version, often called premium support, would include setting premiums to both MA and FFS based on bids, where the “bid” for FFS would be risk-score-adjusted expenditures in FFS. Premium support would likely disrupt significantly the FFS system relied upon by 28 million seniors, with coding differences and biased selection contributing to MA plans bidding below FFS. The prospect of charging significantly higher premiums for FFS beneficiaries would be unfair and effectively undermines the viability of premium support.
An alternative approach would restrict competitive bidding to setting payment rates for MA, using market forces to determine what Medicare pays MA plans.23 To the degree that MA plans are more efficient, such competition would lead to some of this efficiency being captured by taxpayers instead of extra benefits for enrollees and overly large MA plan profits. The Senate version of the 2010 Affordable Care Act (ACA) included a competitive-bidding provision but the final (Reconciliation) version of the ACA replaced competitive bidding with the current quartile payment system. Despite having similar budget savings, House leaders and MA plan sponsors opposed competitive bidding and instead developed the quartile system.
The prospects for competitive bidding will involve three broad questions: What are the likely policy alternatives, how much more generous would MA benefits be than FFS, and what are the transition rules and timing? Fiscal considerations (large MA overpayments, the looming insolvency of the Federal Hospital Insurance Trust Fund and federal deficits) and programmatic concerns (favorable selection, tying MA payments to the extent of upcoding and problems with linking MA payments to FFS expenditures) will shape reform proposals and industry preferences.
Decoupling MA plan payments from FFS recognizes that Medicare is currently bifurcated. An increasing majority of beneficiaries eligible for MA choose private plans offering richer benefits and lower out-of-pocket expenditures despite restrictions associated with utilization management and contracted provider networks. Somewhat less than half of beneficiaries participate in the government-run FFS system offering fewer benefits and fewer restrictions.
Without fundamental reform, payments to MA plans will grow more excessive with the increasing shift from FFS to MA of beneficiaries with below-average, risk-score-adjusted expenditures. As the number and share of beneficiaries in FFS continues to decline, using their expenditures as the basis for setting MA payment rates becomes increasingly problematic and expensive, even before considering coding differences.
Disclosure:
The Schaeffer Center White Paper Series is published by the Leonard D. Schaeffer Center for Health Policy & Economics at the University of Southern California. Papers published in this series undergo a rigorous peer-review process, led by the Director of Quality Assurance at the USC Schaeffer Center. This process includes external review by at least two scholars not affiliated with the Center. This white paper was supported by the Schaeffer Center and a grant from Arnold Ventures. A complete list of supporters of the Schaeffer Center can be found in our annual report (available here). At all times, the independence and integrity of the research is paramount, and the Center retains the right to publish all findings from its research activities. The views expressed herein are those of the authors and do not necessarily represent the views of the Schaeffer Center or its sponsors. Disclosures reported by authors are available here.
Footnotes:
a. Multiple studies have estimated the cost of more aggressive coding in MA than FFS, although the extent of upcoding varies by MA plans.
b. Get Started With Medicare, Joining a Plan. https://www.medicare.gov/basics/get-started-with-medicare/get-more-coverage/joining-a-plan.
c. MedPAC Payment Basics, Medicare Advantage Program Payment System. https://www.medpac.gov/wp-content/uploads/2021/11/MedPAC_Payment_Basics_22_MA_FINAL_SEC.pdf.
d. MA payment rates result from multiplying benchmarks times a statutorily set percentage based on the quartile in which the costs fall. Payment rates for plans enrolling 98.4% of MA beneficiaries reflect county costs, with the remainder in plans that use regional rates. CMS, Monthly Contract Summary Report – May 2023, accessed 6/2/23, https://www.cms.gov/files/zip/monthly-contract-summary-report-may-2023.zip. MedPAC, Medicare Advantage program payment system. https://www.medpac.gov/wp-content/uploads/2021/11/MedPAC_Payment_Basics_22_MA_FINAL_SEC.pdf. MA Ratebook2023, https://www.cms.gov/files/zip/2023-ma-rate-book-zip.zip.
e. CMS, 2023 MA Ratebook (zip), April 4, 2022, accessed 5/17/23 https://www.cms.gov/files/zip/2023-ma-rate-book-zip.zip. These rates exclude Alaska.
f. Medicare Monthly Enrollment (Jan. 2023) accessed 5/17/23 https://catalog.data.gov/dataset/medicare-monthly-enrollment; MA State Penetration 2023 04, accessed 4/20/23, https://www.cms.gov/files/zip/monthly-enrollment-state-april-2023.zip.
g. A separate potential issue related to biased selection arises because the CMS HCC system of risk adjustment is developed based on FFS expenditures and utilization; if the migration of less expensive beneficiaries to MA increases the level and alters the distribution of expenditures in FFS, the risk adjustments imputed from FFS beneficiaries might similarly overcompensate MA beneficiaries (a topic beyond the scope of this paper).
h. Claims data in the earlier years of this period only reported ICD-9 diagnostic codes but in later years converted to reporting only ICD-10 diagnostic codes. In subsequent HCC model versions, CMS differentiates between the aged and disabled, with three population segments for the disabled and three for the aged. We replicated our analysis of the disabled and aged using only the aged, and the results were completely consistent and almost unchanged.
i. For Part B non-institutional services, expenditure equals the sum of all the line item-level Medicare payments. For non-hospital services and for other non-institutional services, expenditure equals the total actual Medicare payment amount. Finally, for inpatient services, expenditures include the claim pass-through per diem payments made by Medicare, which is equal to the total amount paid by Medicare for the claim, the pass-through amount multiplied by the number of Medicare-covered days, and then added to the claim payment amount.
j. The 2016 model was applied to all of the years of data. https://www.cms.gov/Medicare/Health-Plans/MedicareAdvtgSpecRateStats/Risk-Adjustors-Items/Risk2016.
k. 2023 Annual Report of the Boards of Trustees of the Federal Hospital Insurance and Federal Supplementary Medical Insurance Trust Funds. https://www.cms.gov/oact/tr/2023.
References
- Trish, E., S. Valdez, P. B. Ginsburg, S. Randall and S. Lieberman. (2022). Substantial Growth in Medicare Advantage and Implications for Reform. Health Affairs, 42 (2): 246-51.
- Code of Federal Regulations, Sec 425.110 Number of ACO professionals and beneficiaries. https://www.ecfr.gov/current/title-42/chapter-IV/subchapter-B/part-425/subpart-B/section-425.110.
- Newhouse J. P., M. Price, J. Huang, J. M. McWilliams and J. Hsu. (2012). Steps to Reduce Favorable Risk Selection in Medicare Advantage Largely Succeeded, Boding Well for Health Insurance Exchanges. Health Affairs, 31 (12): 2618-28.
- McWilliams, J. M., J. Hsu and J. P. Newhouse. (2012). New Risk-Adjustment System Was Associated With Reduced Favorable Selection in Medicare Advantage. Health Affairs, 31 (12): 2630-40.
- Morrisey, M. A., M. L. Kilgore, D. J. Becker, W. Smith and E. Delzell. (2013). Favorable Selection, Risk Adjustment, and the Medicare Advantage Program. Health Services Research, 48 (3): 1039-56.
- Brown, J., M. Duggan, I. Kuziemko and W. Woolston. (2014). How Does Risk Selection Respond to Risk Adjustment? New Evidence From the Medicare Advantage Program. American Economic Review, 104 (10): 3335-64.
- Newhouse, J. P., M. Price, J. M. McWilliams, J. Hsu and T. G. McGuire. (2015). How Much Favorable Selection Is Left in Medicare Advantage? American Journal of Health Economics, 1 (1): 1-26.
- Pope G. C., J. Kautter, R. P. Ellis, A. S. Ash, J. Z. Ayanian, L. I. Iezzoni, M. J. Ingber, J. M. Levy and J. Robst. (2004). Risk Adjustment of Medicare Capitation Payments Using the CMS-HCC Model. Health Care Financing Review, 25 (4): 119-41.
- Centers for Medicare & Medicaid Services. (2021). Report to Congress: Risk Adjustment in Medicare Advantage. https://www.cms.gov/files/document/report-congress-risk-adjustment-medicare-advantage-december-2021.pdf.
- Jacobson, G., T. Neuman and A. Damico. (2019). Do People Who Sign Up for Medicare Advantage Plans Have Lower Medicare Spending? Henry J. Kaiser Family Foundation. https://www.kff.org/medicare/issue-brief/do-people-who-sign-up-for-medicare-advantage-plans-have-lower-medicare-spending.
- MedPAC. (2022). Report to the Congress: Medicare and the Health Care Delivery System. Chapter 7: Ensuring the Accuracy and Completeness of Medicare Advantage Encounter Data. https://www.medpac.gov/document/http-www-medpac-gov-docs-default-source-reports-jun19_medpac_reporttocongress_sec-pdf.
- Ankuda, C. K., K. A. Ornstein, K. E. Covinsky, E. Bollens-Lund, D. E. Meier and A. S. Kelley (2020). Switching Between Medicare Advantage and Traditional Medicare Before and After the Onset of Functional Disability. Health Affairs, 39 (5): 809-18.
- Meyers, D. J., E. Belanger, N. Joyce, J. McHugh, M. Rahman and V. Mor. (2019). Analysis of Drivers of Disenrollment and Plan Switching Among Medicare Advantage Beneficiaries. JAMA Internal Medicine, 179 (4): 524-32.
- Meyers, D. J., M. Rahman, M. Rivera-Hernandez, A. N. Trivedi and V. Mor. (2021). Plan Switching Among Medicare Advantage Beneficiaries With Alzheimer’s Disease and Other Dementias. Alzheimer’s & Dementia, 7 (1): e12150.
- Meyers D. J., E. Belanger, N. Joyce, J. McHugh, M. Rahman and V. Mor. (2019). Analysis of Drivers of Disenrollment and Plan Switching Among Medicare Advantage Beneficiaries. JAMA Internal Medicine, 179 (4): 524-32.
- Rahman, M., L. Keohane, A. N. Trivedi and V. Mor. (2015). High-Cost Patients Had Substantial Rates of Leaving Medicare Advantage and Joining Traditional Medicare. Health Affairs, 34 (10): 1675-81.
- Goldberg, E. M., A. N. Trivedi, V. Mor, H. Y. Jung and M. Rahman. (2017). Favorable Risk Selection in Medicare Advantage: Trends in Mortality and Plan Exits Among Nursing Home Beneficiaries. Medical Care Research and Review, 74 (6): 736-49.
- MedPAC. (2022). Report to the Congress: Medicare Payment Policy. Chapter 12: The Medicare Advantage Program: Status Report and Mandated Report on Dual-Eligible Special Needs Plans. https://www.medpac.gov/wp-content/uploads/2022/03/Mar22_MedPAC_ReportToCongress_Ch12_SEC.pdf.
- Geruso, M., and T. Layton. (2020). Upcoding: Evidence From Medicare on Squishy Risk Adjustment. Journal of Political Economy, 128 (3): 984-1026.
- Chernew, M., K. Miller, A. Petrin and R. Town. (2023). Reducing Medicare Advantage Benchmarks Will Decrease Plan Generosity, but Those Effects Will Likely Be Modest. Health Affairs, 42 (4): 479-87.
- Jacobs, P. D., and R. Kronick. (2018). Getting What We Pay For: How Do Risk‐Based Payments to Medicare Advantage Plans Compare With Alternative Measures of Beneficiary Health Risk? Health Services Research, 53 (6): 4997-5015.
- Centers for Medicare & Medicaid Services. (2023). Announcement of Calendar Year (CY) 2024 Medicare Advantage (MA) Capitation Rates and Part C and Part D Payment Policies. https://www.cms.gov/files/document/2024-announcement-pdf.pdf.
- Lieberman, S. M., L. Adler, E. Trish, J. Antos, J. Bertko and P. A. Ginsburg. (2018). A Proposal to Enhance Competition and Reform Bidding in the Medicare Advantage Program. USC-Brookings Schaeffer Initiative for Health Policy. https://healthpolicy.usc.edu/research/a-proposal-to-enhance-competition-and-reform-bidding-in-the-medicare-advantage-program.
You must be logged in to post a comment.