
Editor’s Note: This white paper is part of the USC-Brookings Schaeffer Initiative for Health Policy, which is a partnership between the Economic Studies Program at Brookings and the USC Schaeffer Center for Health Policy & Economics. The Initiative aims to inform the national healthcare debate with rigorous, evidence-based analysis leading to practical recommendations using the collaborative strengths of USC and Brookings. This work was supported by Arnold Ventures.
Prior research demonstrates that the air ambulance market is characterized by high and fast-growing prices and limited in-network contracting, with patients frequently at risk of surprise out-of-network bills averaging nearly $20,000. Adler, Hannick, and Lee (2020) further detail the concentration of high charges (a list price that is unilaterally set by the provider) among carriers owned by private equity and publicly-traded companies and the large role they play in the market. By 2017, two private equity firms controlled nearly two-thirds of the national Medicare market for both fixed-wing and helicopter air ambulance transports. Both the growth and level of billed charges among providers owned by private equity and publicly-traded companies far exceeded those for other ownership types from 2012 to 2017, which themselves were nonetheless substantial compared to other healthcare specialties.
In this analysis, we build on that prior work to document differences in allowed amounts, out-of-network prevalence, and the magnitude of potential surprise balance bills across ownership types in the helicopter air ambulance market.[1] To do so, we use commercial insurance claims data for years 2014-2017 from the Health Care Cost Institute (HCCI) – comprising claims from Aetna, Humana, and United Healthcare – and data linking air ambulance carriers to their ownership type compiled by Adler, Hannick, and Lee (2020). For prices, we report a standardized allowed amount, which corresponds to the allowed amount for an average distance transport accounting for differences in the mix of services provided. These prices are based on the subset of claims that include the transport’s mileage and point-of-pickup zip code. The remaining analyses utilize the full set of helicopter air ambulance claims in the HCCI data. Further details on our study design can be found in the Methodological Appendix.
Allowed Amounts
We find that allowed amounts for helicopter air ambulance transports from providers owned by private equity or publicly-traded parent companies are significantly more expensive than rides carried out by other providers, with standardized allowed amounts (including both in- and out-of-network rides) averaging $32,051 (5.6 times what Medicare would have paid) in the years 2016-2017, as depicted in Figure 1. This amount was nearly 60% higher than the standardized average allowed amount for rides provided by hospitals, non-profits, and independent companies of $20,146, which was still 3.5 times what Medicare would have paid.[2] The higher allowed amounts for transports by private equity and publicly-traded providers mirrors the higher charges of those providers documented in prior work.
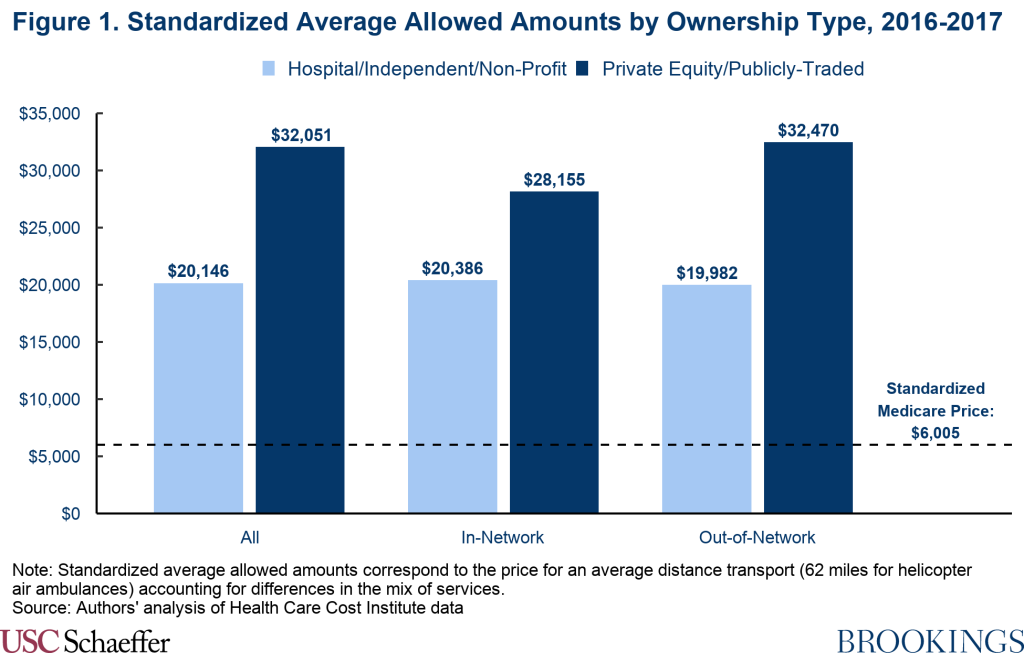
Price differences between private equity or publicly-traded carriers and all other carriers are similar for in- and out-of-network claims. Allowed amounts are substantially higher than Medicare rates across ownership types and network statuses, but rides delivered by private equity and publicly-traded providers are consistently the most expensive.
Out-of-Network Prevalence and the Likelihood of Potential Surprise Bills
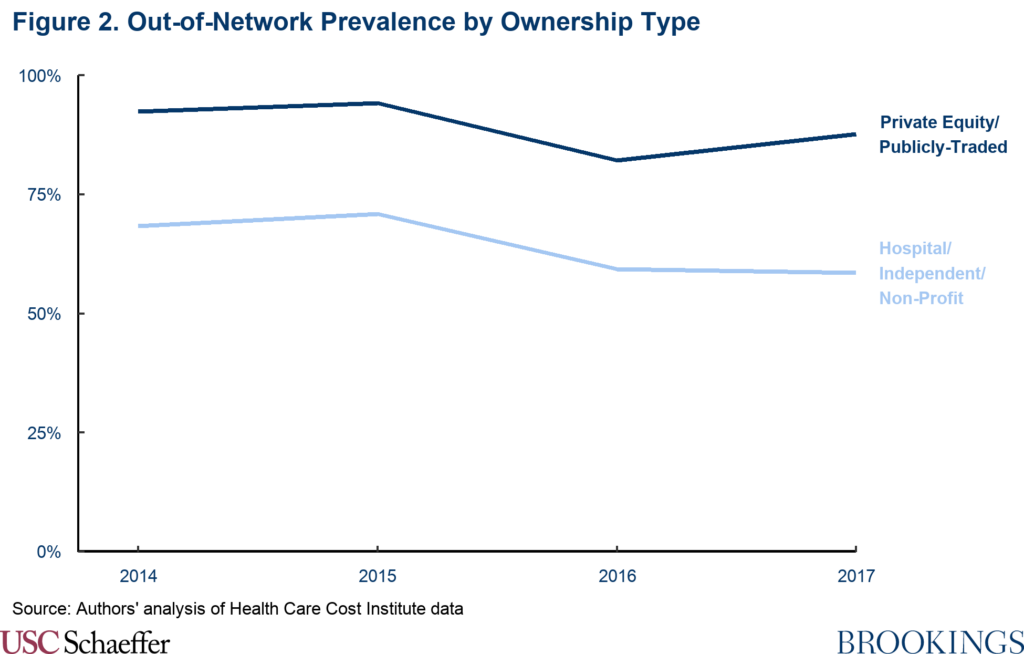
Using the same HCCI data, Fuse Brown et al. (2020) estimate that 77% of all helicopter air ambulance transports were performed by out-of-network providers between 2014 and 2017. But this disguises significant differences across ownership types. Rides delivered by private equity and publicly-traded providers were substantially less likely to be in-network with insurers, with 89% of their transports between 2014 and 2017 being completed out-of-network. By contrast, providers owned by hospitals, non-profits, and independent companies completed 59% of rides out-of-network in 2017, representing a modest decline from 68% in 2014.
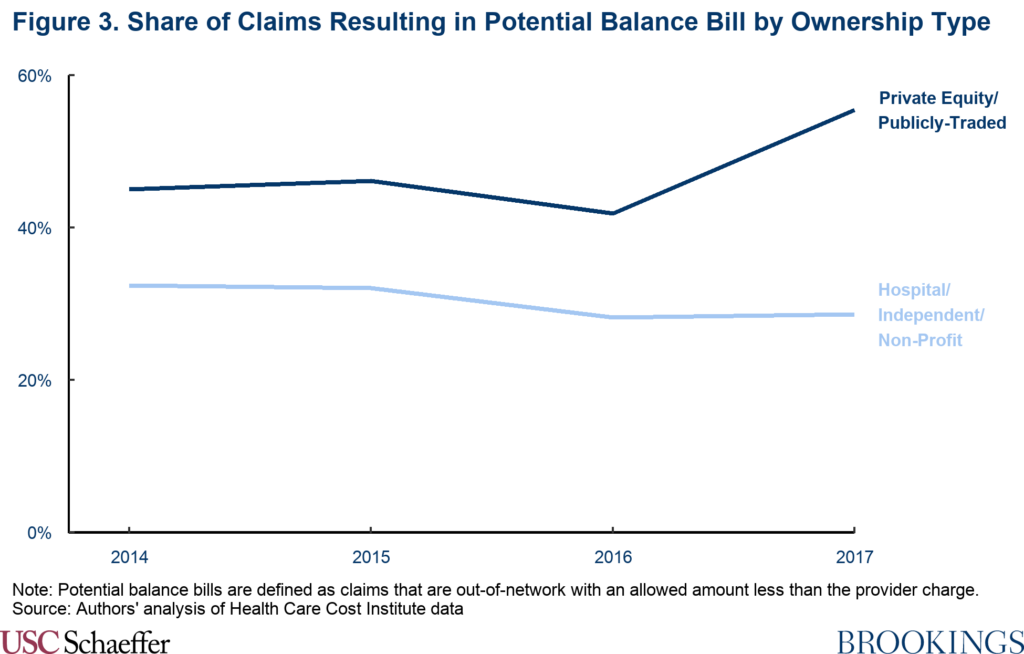
When a patient is transported by an out-of-network air ambulance, the carrier can balance bill the patient for the difference between its charge and the insurer’s allowed amount. But in many cases, the insurer elects to set its allowed amount equal to the provider’s full charge, which eliminates any potential for a surprise balance bill to the patient. We find that this occurs more frequently for transports provided by carriers not owned by private equity or publicly-traded companies, presumably because their charges are substantially lower. Similar to earlier findings comparing air ambulance charges reported to Medicare, in the HCCI data we estimate that the standardized average charge set by providers owned by private equity and publicly-traded companies across 2016 and 2017 was $48,155 (8.3 times Medicare prices). This amount was more than 75% higher than other providers’ standardized average charges of $27,366 (4.7 times Medicare prices).
As a result, we estimate that 55% of all helicopter transports delivered by private equity and publicly-traded carriers had the potential to result in a balance bill in 2017, compared with 29% of transports from hospital, non-profit, and independently-owned providers.
Magnitude of Surprise Bills
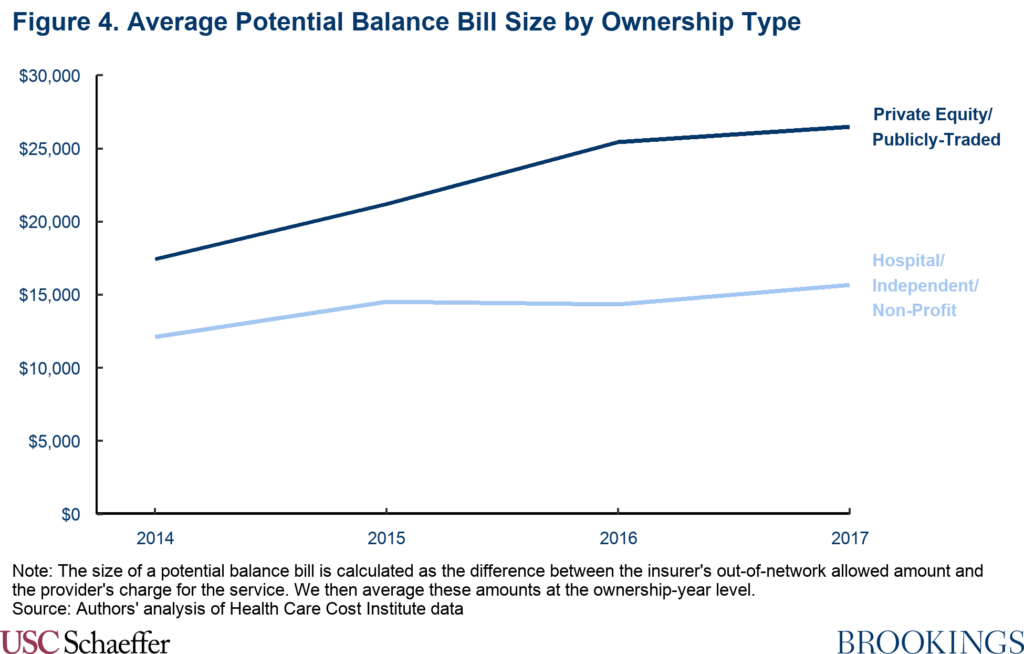
Not only are potential surprise bills nearly twice as likely from an air ambulance owned by a private equity or publicly-traded company, they are also substantially more expensive.
This difference persists despite private equity and publicly-traded air ambulances receiving out-of-network allowed amounts substantially higher than other carriers (see Figure 1), a byproduct of also charging much higher list prices than other carriers not owned by private equity or publicly-traded companies.
The size of potential balance bills from air ambulance carriers owned by private equity or publicly-traded companies also grew more than 50% between 2014 and 2017, reaching an average of $26,507 in 2017. Out-of-network allowed amounts remained similar over the four-year period, so this growth was driven by fast-rising charges. Other providers, by contrast, had an average potential balance bill of $15,671 – still a very high amount, but 41% lower than potential surprise bills from private equity or publicly-traded air ambulance carriers.[3]
Discussion
With the recent passage of the No Surprises Act, air ambulance carriers will be among the host of providers barred from billing patients for more than in-network cost-sharing amounts starting on January 1, 2022. This analysis, therefore, highlights the importance and magnitude of the direct financial protection being afforded to patients by the No Surprises Act. The high share of claims resulting in potential balance bills combined with elevated charges, at present, leaves many air ambulance patients at risk of receiving an enormous medical bill after their transport. This risk is most pronounced when patients are transported by a private equity or publicly-traded provider. When transported by a private equity or publicly-traded air ambulance, we estimate that the patient had a 55% chance of being left potentially liable for a surprise out-of-network balance bill averaging more than $25,000 in 2017. This contrasts to a 29% chance of being at risk of a balance bill averaging $15,671 when transported by an air ambulance not owned by a private equity or publicly-traded carrier.
While the No Surprises Act will protect consumers, the law’s arbitration process to settle payment disputes between insurers and out-of-network providers will have important effects on payments for these services. Arbitrators are instructed to begin with the presumption that the appropriate out-of-network price is the “qualifying payment amount” (QPA), defined as the median contracted rate for a service within a geographic region and insurance market across an issuer’s health plans as of January 31, 2019, adjusted forward for inflation. Certain other factors may also be taken into account, although a provider’s billed charges are notably prohibited from consideration, as are public payer rates.
If arbitration decisions tend to follow the QPA, the No Surprises Act should mitigate further increases in prices in future years. However, the law also has the potential to lower existing prices. The highest in-network prices seem to be heavily concentrated in providers owned by private equity and publicly-traded companies, who also dominate the market. Medians by their nature give less weight to outliers, but this is especially true for the QPA because it is calculated as the median among the average rates paid under each provider contract. Insurers typically have a single contract with each provider regardless of the provider’s size, meaning an insurer contract with a large, private equity-owned provider receives no more weight in the QPA calculation than an in-network contract with a small local provider or hospital.
There is, however, some risk that arbitration decisions could deviate from the QPA. Notably, arbitrators may also consider previously contracted rates between an insurer-provider pair, which could be particularly likely to lead to outcomes above the QPA in the case of the private equity and publicly-traded companies that get paid the highest in-network prices today. And even the QPA may be higher than the price that would emerge from a well-functioning market in light of the rapid increase in prices over the last decade. (Fiedler, Adler, and Ippolito (2021) recommend that arbitrators should discount previously contracted rates that are likely to have been inflated by leverage tied to balance billing practices, as seems plausible in the case of air ambulance carriers in general, and particularly for private equity and publicly-traded providers, but the Interim Final Rules implementing the No Surprises Act do not impose this type of requirement.)
In sum, the high frequency and size of potential balance bills that are the main focus of this analysis will no longer directly impact patients transported by air ambulances starting January 1, 2022. Payments for air ambulance services—and, as a result, insurance premiums—will likely be lower than they would have been without the law, but perhaps still unjustifiably high. The No Surprises Act serves as important protection for patients, but more can still be done to improve the market for air ambulance services.
Methodological Appendix
We use Health Care Cost Institute (HCCI) data from 2014-2017, which includes claims-level data for air ambulance services. Each claim-level observation includes the provider’s encrypted national provider identifier (NPI), the claim’s allowed amount, charge, network status, service date, and HCPCS code billed. We focus on claims with HCPCS codes A0431 and A0436 which are the base pickup and per statute mile codes, respectively, for helicopter air ambulances.
We utilize the crosswalk constructed by Adler, Hannick, and Lee (2020) that identifies the ownership type of each air ambulance NPI that bills Medicare in each year, and merge this information onto HCCI claims by NPI and year. We exclude claims where the provider’s NPI is missing in our sample. We also exclude claims where the insurer is the secondary payer, claims with a charge or allowed amount less than $1, claims with more than one network status, claims that do not have both the base and mileage CPT codes, and claims with providers not based in the 50 U.S. states or the District of Columbia. The providers are grouped into three ownership groups: Private Equity/Publicly-Traded, Hospital/Independent/Non-Profit, and Municipal/Other. Due to very small sample sizes and negligible market share, we exclude the Municipal/Other estimates from the main text and report only metrics from the first two ownership groups.
In order to make comparable estimates of allowed amounts and charges across varying length of flights and area of pickups (Medicare prices differ depending on whether the pickup occurred in a rural or urban zip code), we construct standardized averages of these metrics. In order to do so, we need claim-level information on the number of miles traveled for a given transport. This information is only available for claims with place of service (POS) identifier = 42, so all standardized averages reported in the main text come from the subset of observations with this identifier. The standardized average values are calculated by multiplying each claim’s mileage rate by the average distance of transport (62 miles for helicopters) and adding that amount to the claim’s base rate.
To create comparisons to Medicare prices, we further restrict the sample to interfacility transports in 2016 and 2017 with POS identifier = 42. Since the HCCI data do not include an indicator for where an air ambulance pickup occurred, we restrict the data to a subset of interfacility transports for which we can identify whether the pickup was urban or rural based on the zip code of the facility from which each patient was transferred. We then generate the equivalent Medicare price for each claim by summing the Medicare base amount and Medicare mileage rate (again multiplied by the average distance of transport) for the appropriate type of claim.
For estimates of out-of-network prevalence, potential balance bill prevalence and size, we use the full HCCI data sample. Each claim in the dataset includes an allowed amount, charge, and the network status of the claim. We characterize air ambulance claims with a missing network status indicator in the HCCI data as out-of-network, reflecting analysis that strongly suggested missing network status claims were predominantly out-of-network (see Fuse Brown et al. 2020). This allows us to estimate the share of all claims that were out-of-network with an allowed amount less than the provider charge (i.e. not paid in full), which constitutes a potential balance bill for our purposes. For each claim that is a potential balance bill, we report the difference between the out-of-network allowed amount and charge for that claim as the size of the potential balance bill. We then average these amounts at the ownership-year level to generate the estimates reported in the analysis.
[1] We do not report detailed results from the fixed-wing market (CPT codes A0430 and A0435) due to a small number of claims available in our sample.
[2] We note that these estimates come from a subsample of the HCCI data that encompasses only interfacility transports. The use of this restricted sample is due to data limitations in creating a comparable Medicare price from the full HCCI data. Relative price differences by ownership type appear qualitatively similar when using all HCCI air ambulance claims, but we are unable to make more standardized comparisons or calculate the relevant Medicare price in the broader data. Full details can be found in the Methodological Appendix.
[3] The potential balance bill size we report represents the raw difference between allowed amounts and charges for claims that were out-of-network and not paid in full. It is not equalized for the length of rides, as was the case with our reported standardized averages for allowed amounts and charges. Full details can be found in the Methodological Appendix.
You must be logged in to post a comment.