Key Takeaways
- Rebates – as a share of total drug spending – have grown considerably over the last decade.
- Because of how rebates are implemented in Medicare Part D, patient cost-sharing is based on the list (pre-rebate) price of drugs, not the net price reflecting these negotiated discounts.
- If cost-sharing were based on net price, it would reduce out-of-pocket spending for nearly half of Part D beneficiaries who do not receive low-income subsidies.
- Approximately 20 percent of these beneficiaries would save more than $100 per year and about one percent would save more than $1,000 per year.
- Basing cost-sharing on net price, rather than list price, would provide meaningful financial relief to many Part D beneficiaries.
A press release covering this white paper’s findings is available here.
Abstract
The Medicare Part D program allows plans to negotiate rebates directly with manufacturers, often in exchange for preferential placement on the plan’s formulary. These rebates have grown from about 10 percent of Part D spending in 2007 to about 22 percent in 2017. While these rebates help keep Part D premiums low, they do so at a cost. Because of how rebates are implemented in Part D, patient cost- sharing is based on the list price, not the net price after rebates and other discounts. The result is that the patient does not share in the negotiated savings at the point of sale.
We modeled a Part D policy change that would base beneficiary cost-sharing on net, rather than list, price for patients who do not receive low-income subsidies. We find that such a policy change would reduce out-of-pocket spending for about 47 percent of these beneficiaries. Approximately 20 percent would save more than $100 over the year; and about one percent would save more than $1,000. Moreover, we find that 36 percent fewer of these beneficiaries would reach catastrophic coverage, resulting in federal reinsurance savings of about 19 percent. These results indicate that tying cost- sharing to net price would provide meaningful financial relief to many Part D beneficiaries.
Background
Drug prices have received much attention recently, and Americans rank “taking action to lower prescription drug prices” as their top priority for Congress.[1] This focus is understandable — the average transaction (or “list”) price of branded and specialty drugs has increased about 10 to 20 percent annually over the last decade,[2] and 29 percent of adults report not taking their medicine as prescribed because of cost.[3]
However, focusing on the growth of list prices obscures an important component of the prescription drug market: the role of rebates. A drug’s list price is the total amount paid to the pharmacy when a patient fills a prescription. Rebates are discounts off these list prices, typically paid by manufacturers to pharmacy benefit managers and plans in exchange for preferred formulary placement (and thus an expectation of higher volume), which in turn can be used to reduce premiums.[4] Dynamics of the prescription drug supply chain and prescription drug insurance markets, including the Medicare Part D program, have encouraged a trend toward higher list prices with commensurately larger rebates over time.[5,6]
Rebates have grown considerably in recent years. Within Medicare Part D, rebates have more than doubled as a share of total spending since the program’s inception – from 9.6 percent in 2007 to 21.8 percent in 2017.[7] After accounting for rebates and other discounts – as well as product mix – the growth in net prices of prescription drugs across the broader market has actually been relatively flat in recent years.[8]
However, many patients have not directly benefitted at the pharmacy counter from this slow growth in net prices, because patient cost-sharing is increasingly based on a percentage of the drug’s list (i.e., pre-rebate) rather than net (i.e., post-rebate) price. Thus, beneficiaries who take drugs with high rebates pay higher cost- sharing than they would if that cost-sharing were instead based on the drug’s net price. In effect, because these beneficiaries pay higher out-of-pocket costs, they are subsidizing lower premiums for all beneficiaries.
While the Trump administration had proposed a policy that would have banned rebates in Medicare Part D,[9] they have since pulled back on this proposal, likely because of concerns about higher premiums and increased federal spending.[10] Recent Congressional proposals to reform the Part D program do not directly address beneficiaries’ cost-sharing being tied to list rather than net price,[11,12] although policymakers have expressed an interest in doing so.[13] Given the significant distortions that these rebates create for beneficiary cost-sharing, it is important for policymakers to understand the magnitude and distribution of the effect that a policy change tying cost-sharing to net, rather than list, price would have as they weigh the merits of various potential program reforms.
In this paper, we provide empirical evidence on this point by modeling the impact on out-of-pocket spending in Medicare Part D if beneficiary cost-sharing were based on net price. We use a stylized model based on the Part D standard benefit design, which does not capture all the nuances of actual Part D plans’ formulary and benefit design details, but does provide a reasonable estimate of expected average changes in patient out-of-pocket spending under such a policy change. Although there may be dynamic effects – such as changes in net drug prices and/or beneficiary demand – accurately predicting the magnitude of such effects is difficult. We instead focus on the static effects by assuming no change in net drug prices nor utilization. However, we believe that it is indeed feasible to tie beneficiary cost-sharing to net, rather than list, price while preserving the competitive incentives necessary to enable purchasers to negotiate discounted net prices. For example, it would be important to continue to allow Part D plans to use tiered co-payments under such a policy change (rather than requiring them to use co-insurance under the standard benefit design) to maintain plans’ negotiating leverage. Moreover, many commercial insurers have already adopted such changes, suggesting that it is indeed practicable to do so. Our findings provide important insight into the distortions in beneficiary out-of-pocket spending created by the growing divergence of list and net prices in Medicare Part D.
Methods
We model the impact of basing beneficiary cost-sharing in Medicare Part D on net, rather than list, price (effectively requiring plans to share rebates with beneficiaries at the point of sale). We use a 100 percent sample of 2016 Medicare Part D claims data accessed through the Centers for Medicare and Medicaid Services (CMS) Virtual Research Data Center (VRDC). At a high level, we take each claim and “re-process” it under an alternative scenario where the total drug cost on the claim reflects the net price. To do so, we first apply an estimated rebate (described in more detail below) to the total list price of each claim to estimate net price. We then calculate beneficiary cost-sharing by applying the standard benefit design to this net price, and advance the beneficiary through the benefit phases accordingly. We repeat this process for each of the beneficiary’s successive claims for the entire year.
Because our primary focus is on changes in beneficiary cost-sharing, we restrict our analysis to beneficiaries who do not receive low-income subsidies (LIS), since the vast majority of cost-sharing for LIS beneficiaries is paid by the federal government in the form of low-income cost-sharing subsidies. These non-LIS beneficiaries represent approximately 70 percent of total Part D enrollment. Our sample includes claims from beneficiaries who are enrolled in either a stand- alone prescription drug plan (PDP) or a Medicare Advantage plan with prescription drug benefits (MA- PD), though we exclude beneficiaries who are enrolled in an employer-sponsored Part D plan (EGWP).[i] Moreover, our sample includes beneficiaries who are enrolled in basic plans (i.e., plans that are actuarially equivalent to the standard benefit design) and enhanced plans (i.e., plans that are actuarially more generous than the standard benefit design).
Only a small minority of Part D plans used the standard benefit design in 2016; most plans used formularies with tiered cost-sharing parameters. In order to simplify the analysis and make it consistent across beneficiaries in different plans (including those in enhanced plans) we first process all outpatient prescription drug claims for each beneficiary based on list price under the basic, standard benefit design (Appendix Table 1).[ii] We then re-process the same set of claims through the standard benefit design using net price. This enables us to make a direct comparison under the exact same, consistent benefit design structure across all beneficiaries, rather than having such an analysis reflect the details of the actual plan in which the beneficiary is enrolled. (We assume no changes in utilization nor prices under the standard benefit design compared to the beneficiary’s actual plan design, nor any changes under net rather than list prices.)
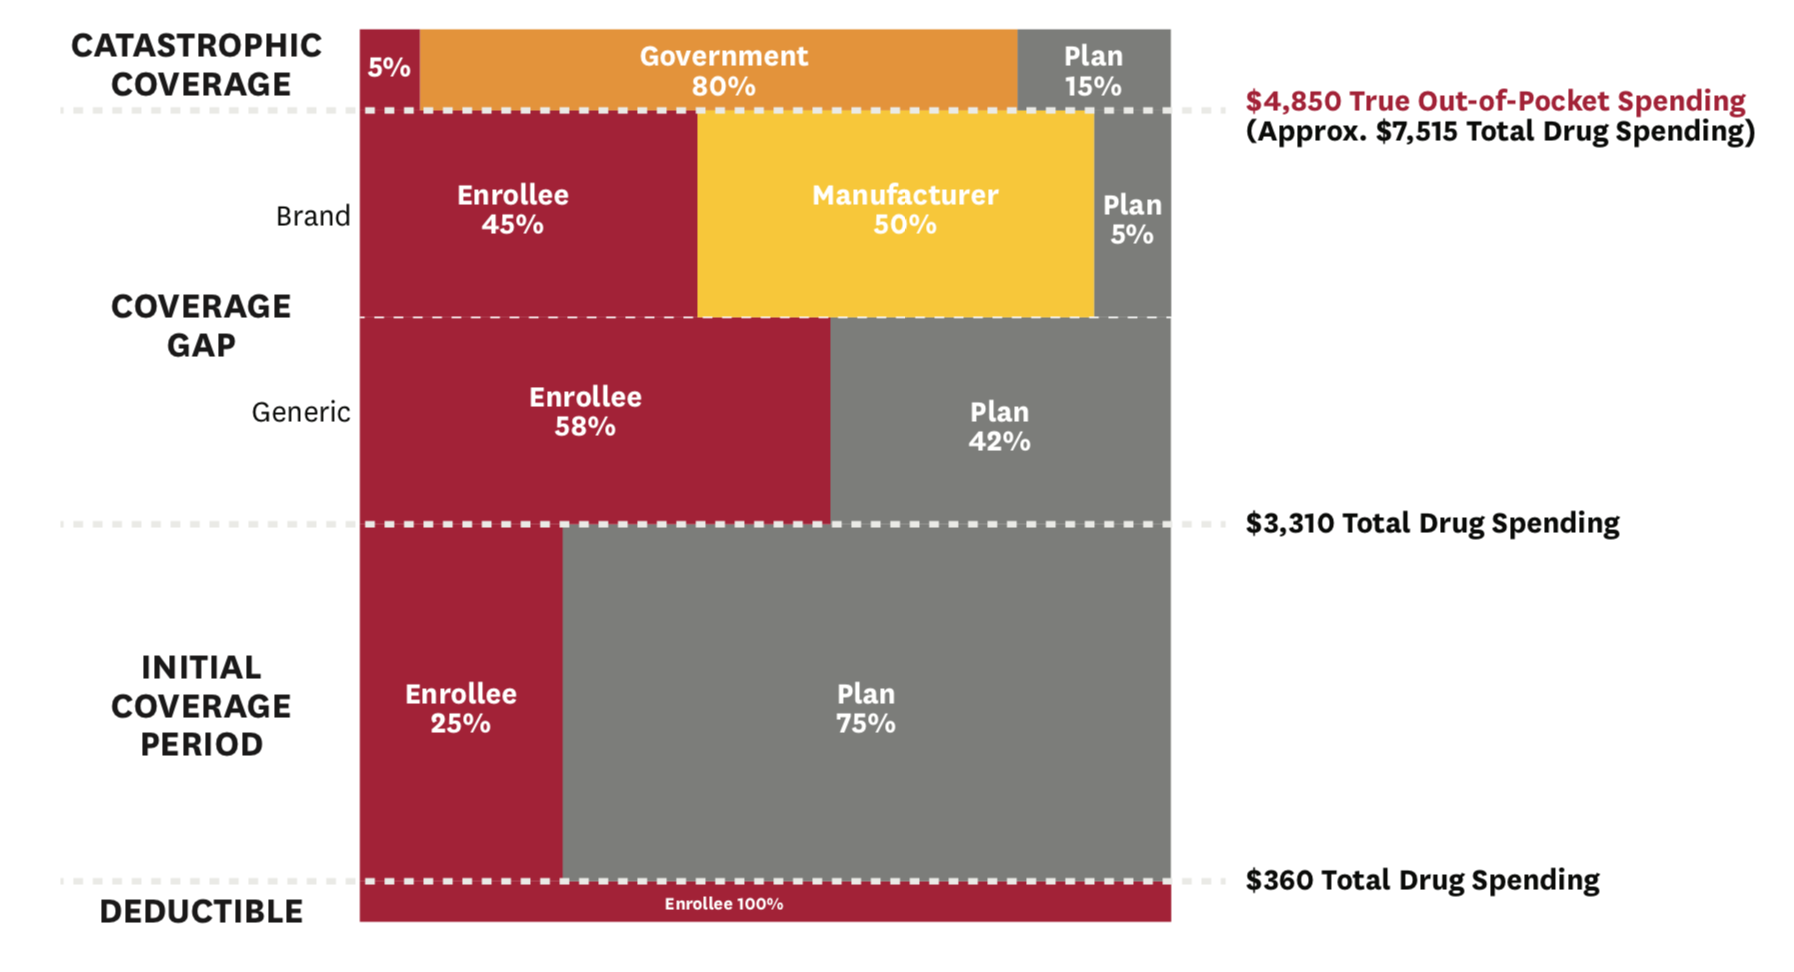
Under the 2016 standard benefit design, non-LIS beneficiaries face a $360 deductible, after which they enter the initial coverage period, in which they pay 25 percent co-insurance up to $3,310 in total drug spending (Figure 1). After that, they move into the coverage gap phase, in which they pay 45 percent co-insurance on branded drugs and 58 percent co-insurance on generic drugs. Though beneficiaries
transition through these first three phases based on total spending, they move from the coverage gap to the catastrophic coverage phase based on “true” out-of- pocket (TrOOP) spending. Thus, we track cumulative TrOOP spending after each re-processed claim, in addition to tracking cumulative total drug spending. Once a beneficiary accumulates $4,850 in TrOOP spending, they move into catastrophic coverage, in which they face 5 percent co-insurance on all drug spending for the remainder of the year. Under the 2016 standard benefit design, manufacturers pay 50 percent co-insurance on branded drugs for non-LIS beneficiaries in the coverage gap phase, which counts toward TrOOP, even though it is not actually paid by the beneficiary.
Figure 1: 2016 Part D Standard Benefit Design
We compute total spending and beneficiary out-of- pocket spending based on the standard benefit design under our two scenarios (where total drug spending and cost-sharing are based on list and net price, respectively), and present results for the distribution of the change in beneficiary out-of-pocket spending. We include manufacturer payments in our cumulative TrOOP measures, but not in our reported estimates of changes in beneficiary out-of-pocket spending, which represent only the actual patient-paid amounts. Additionally, we evaluate the change in total out-of- pocket spending (across all drugs) among beneficiaries who take the ten drugs with the highest average out- of-pocket spending per non-LIS Part D user.[14] Finally, we evaluate the change in the distribution of the benefit phases in which beneficiaries end the year under these two alternative policy scenarios.
Rebate Estimates
To generate a net price, we merge estimated rebates for branded drugs to each claim, and then discount the list price of each claim by that estimated rebate. (We assume that generic drugs have no rebates.) These rebate estimates for branded drugs are derived at the Generic Product Identifier (GPI) level, according to the degree of product uniqueness (proxied by the number of competitors), as drugs with more competitors have been shown to have higher rebates.[15,iii] To account for the fact that Part D protected classes have lower average rebates,[16] we subtract 10 percentage points off the rebate estimates for protected class drugs. We crosswalk these rebate estimates from the GPI-level to the national drug code (NDC)-level and merge these NDC-level rebate estimates with the Part D claims data.
After merging these rebate estimates with the Part D claims data, we compared our utilization-weighted estimated rebate percentages to several existing sources of aggregate rebate data. Specifically, we compared our estimated rebates to:
- overall rebates as a share of total Part D spending from the Medicare Trustees’ Report,[17]
- class-level rebate estimates from CMS,[18] and
- drug type-level (i.e., branded specialty and branded non-specialty) estimates from the Congressional Budget Office (CBO).[19,iv]
Initially, our estimates of rebates on branded specialty drugs were considerably higher than those reported by CBO; we therefore divided all estimated rebates for specialty drugs in half. After this adjustment, our rebate estimates track relatively well with overall, class- level, and drug type-level rebate estimates from various sources (Appendix Table 2). While there is certainly error in our individual drug-level rebate estimates, we believe that these estimates represent a reasonable approximation of actual rebates, and we are not aware of a better comprehensive data source on actual rebates available to researchers.
Results
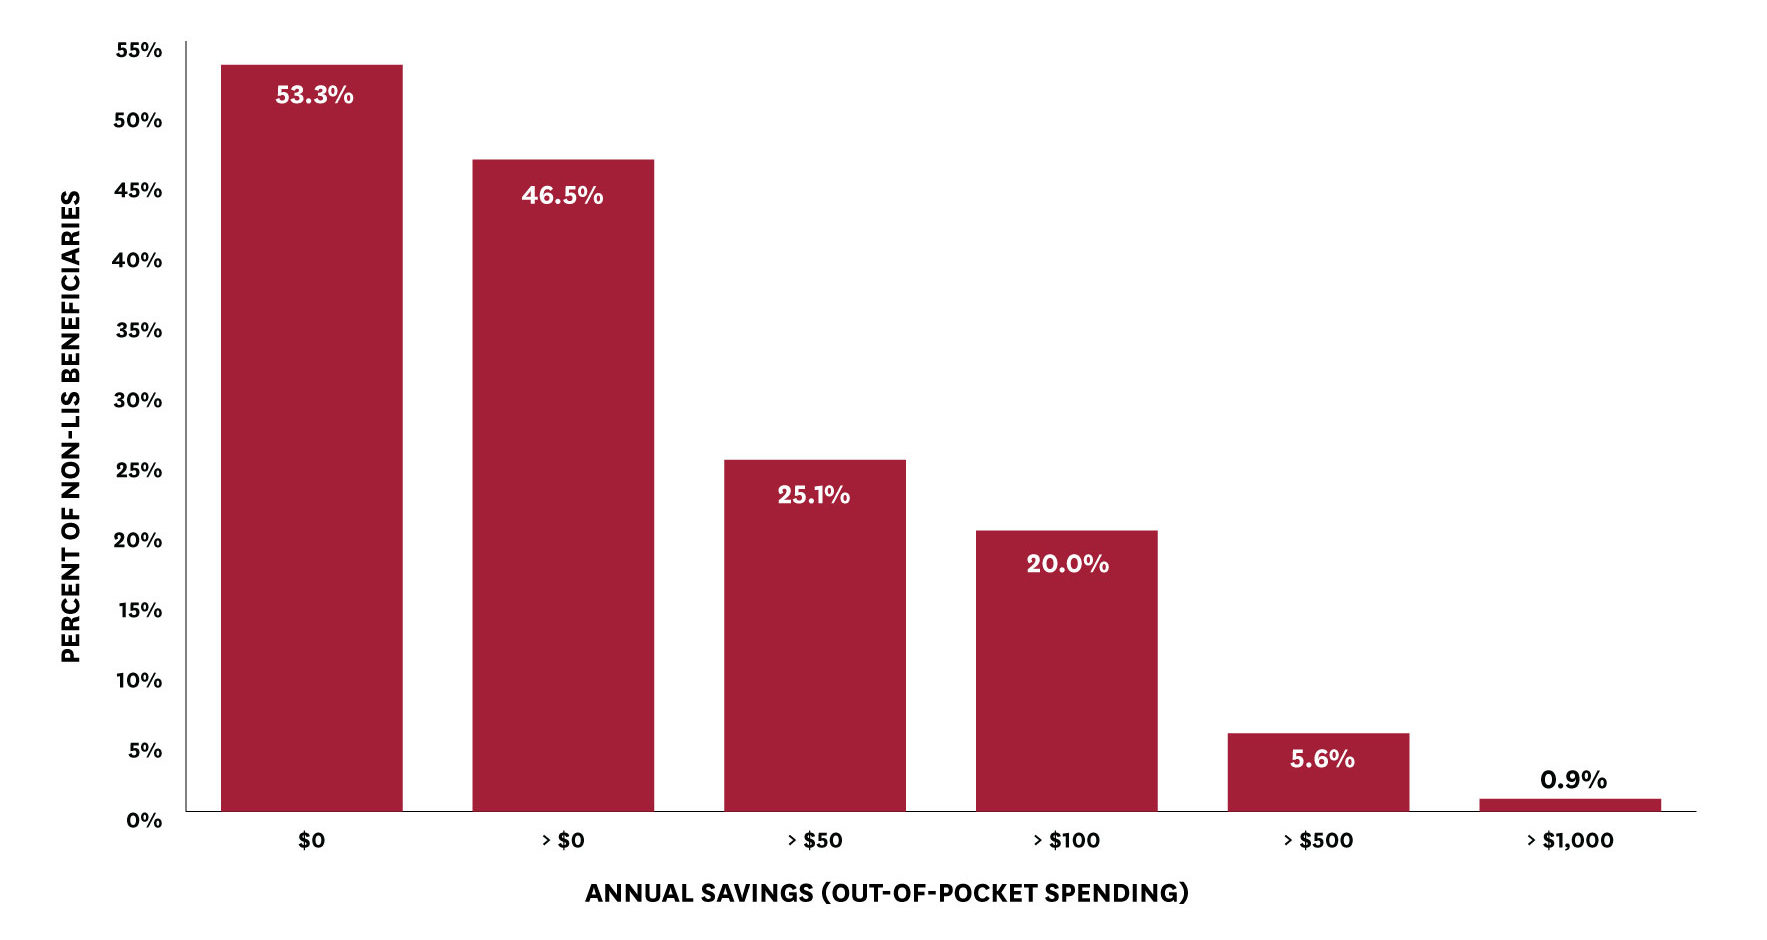
We find that basing beneficiary cost-sharing (and beneficiary progression through the benefit phases) on net, rather than list, price would reduce annual out-of-pocket spending among non-LIS beneficiaries (with non-zero spending) by $91, on average (from $716 to $625). However, this average reduction masks considerable variation across beneficiaries depending on the level and type of medications used. Almost half of non-LIS beneficiaries would see a reduction in out-of-pocket spending with cost-sharing based on net price (Figure 2).[v] Twenty percent of beneficiaries would see annual out-of-pocket savings of more than $100, more than five percent would see annual savings of more than $500, and nearly one percent would see annual savings of more than $1,000 (Figure 2).
Figure 2: Beneficiary Out-of-Pocket Savings from a Net Price Policy
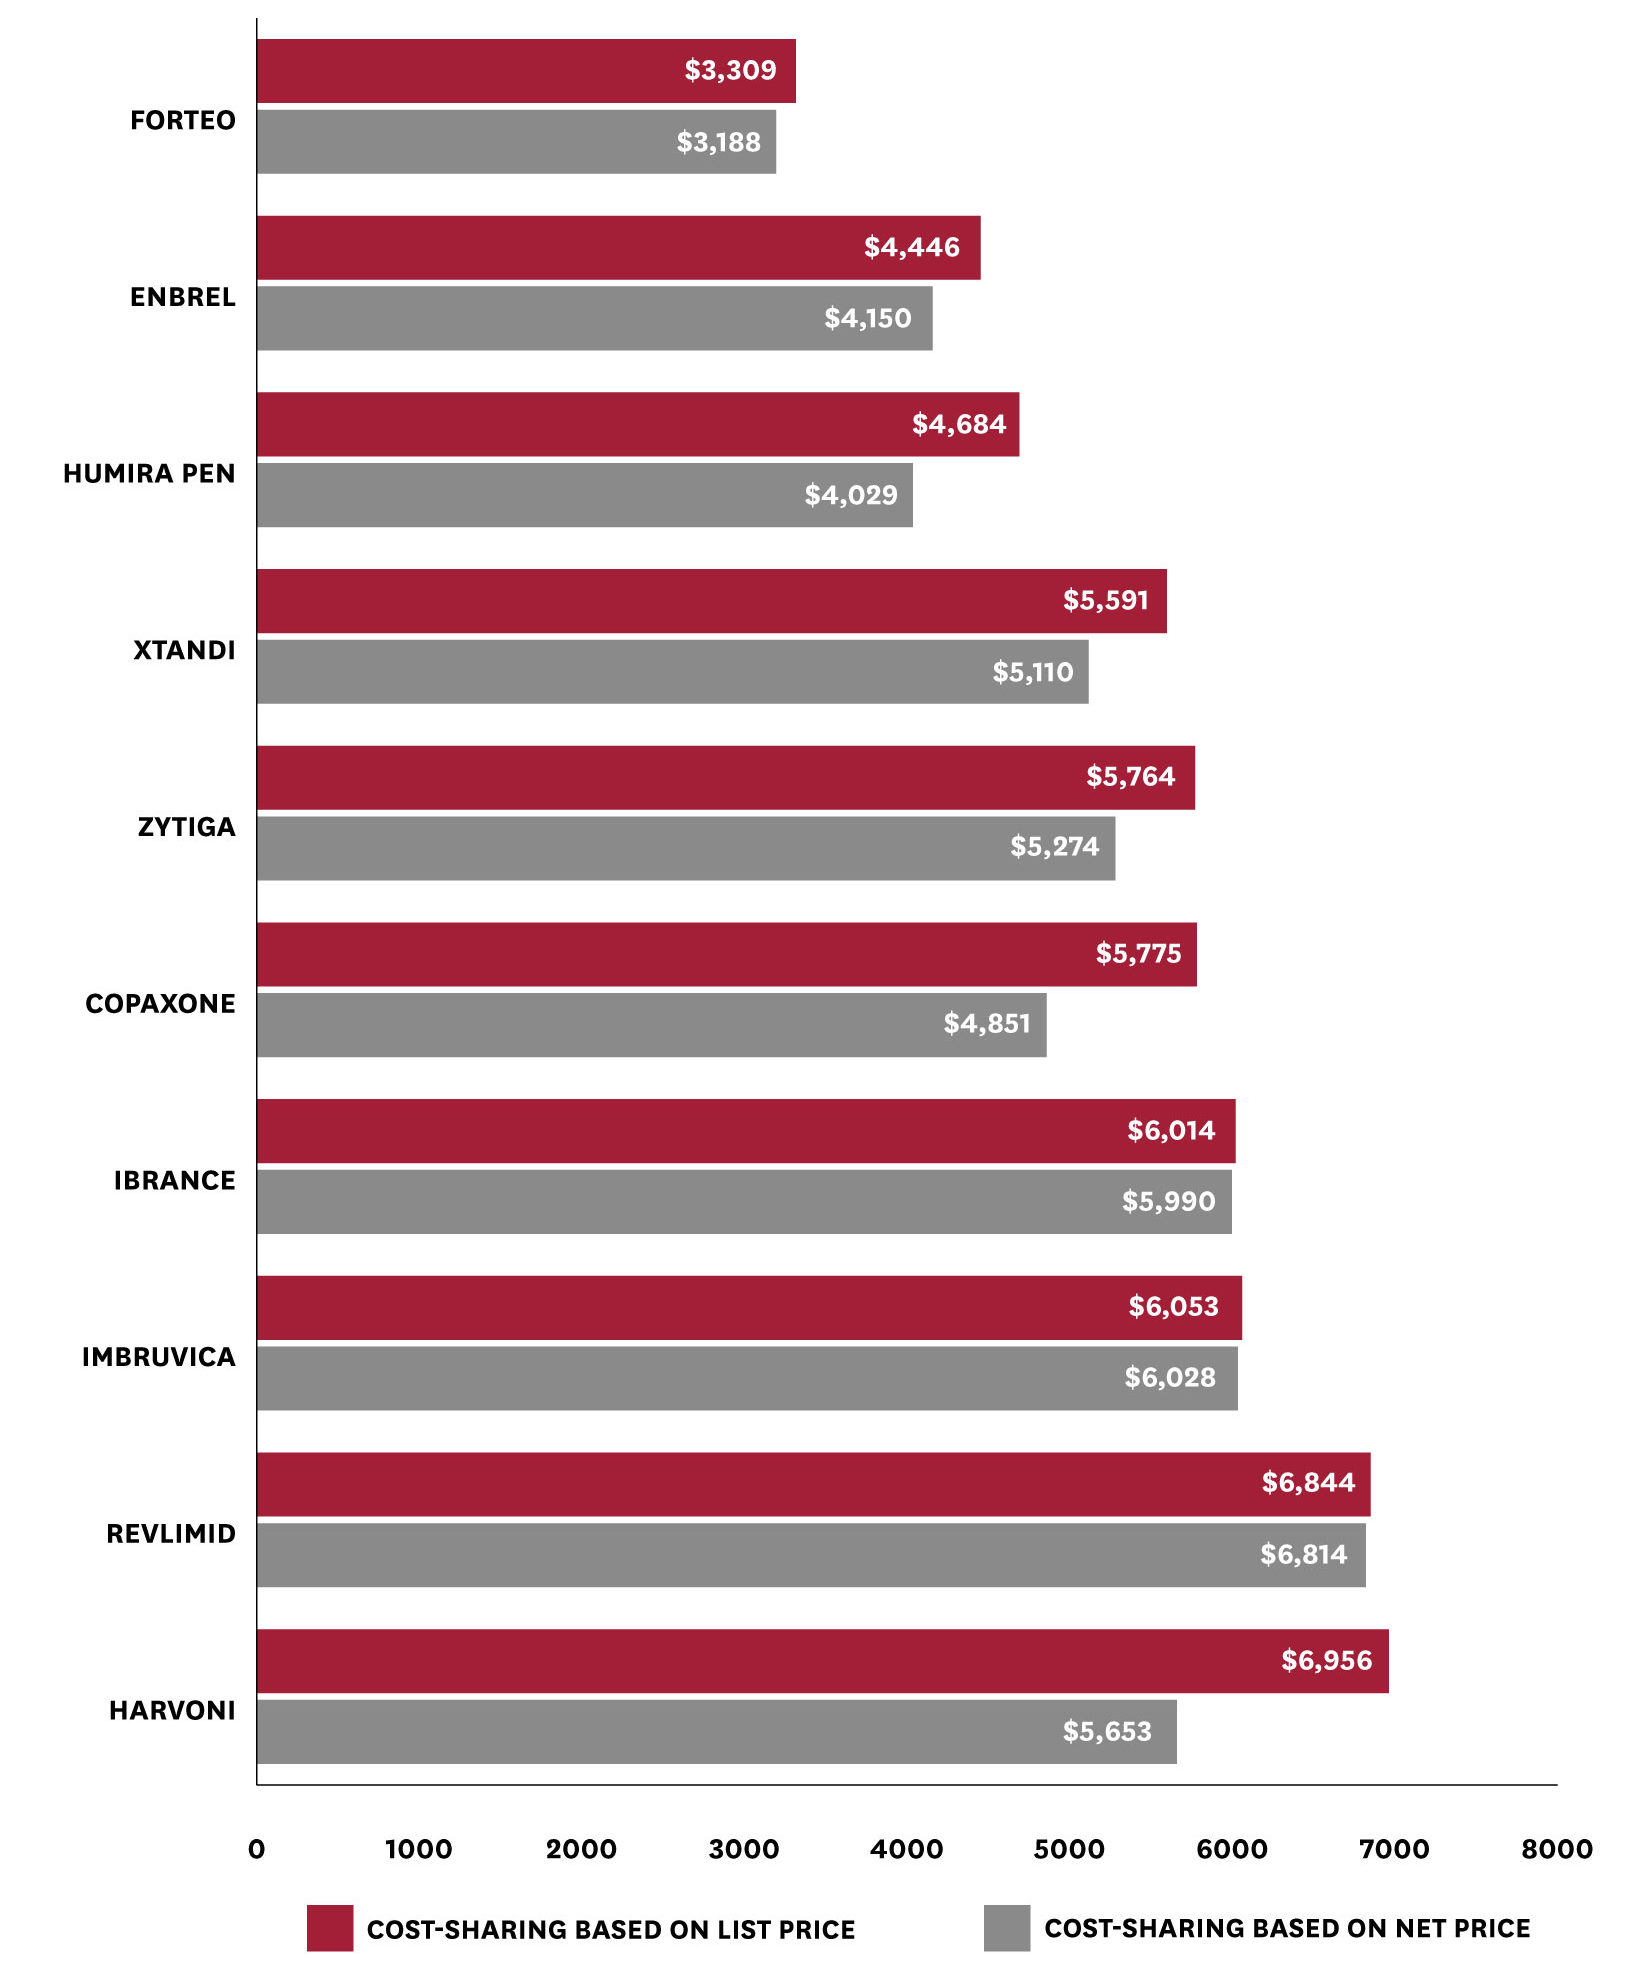
Among users of the ten drugs with the highest average out-of-pocket spending per user in 2016, basing out-of-pocket spending on net, rather than list, prices generates widely varying savings (Figure 3). For example, among users of Harvoni (a drug to treat Hepatitis C), average out-of-pocket spending (on all drugs) falls by $1,303 (from $6,956 to $5,653). In contrast, average changes in out-of-pocket spending among users of Ibrance – a drug used to treat breast cancer – are minimal, falling by only $24 (from $6,014 to $5,990). This distribution reflects the variation in rebates across different drugs and therapeutic classes. That is, while all the patients included in Figure 3 take drugs with high average cost-sharing, basing cost-sharing on net, rather than list, price would make a sizeable difference for patients who take high- cost drugs with high rebates, but little difference for patients who take high-cost drugs with low or no rebates. In particular, we observe lower reductions in average out-of-pocket spending among users of the five protected class drugs included in Figure 3 (i.e., Revlimid, Imbruvica, Ibrance, Zytiga, and Xtandi), though we reiterate that these estimates include users’ out-of-pocket spending across all the drugs they take.
Figure 3: Mean Total Annual Out-of-Pocket Spending with a List vs. Net Price Policy, Among Patients Taking Drugs with High Out-of-Pocket Spending
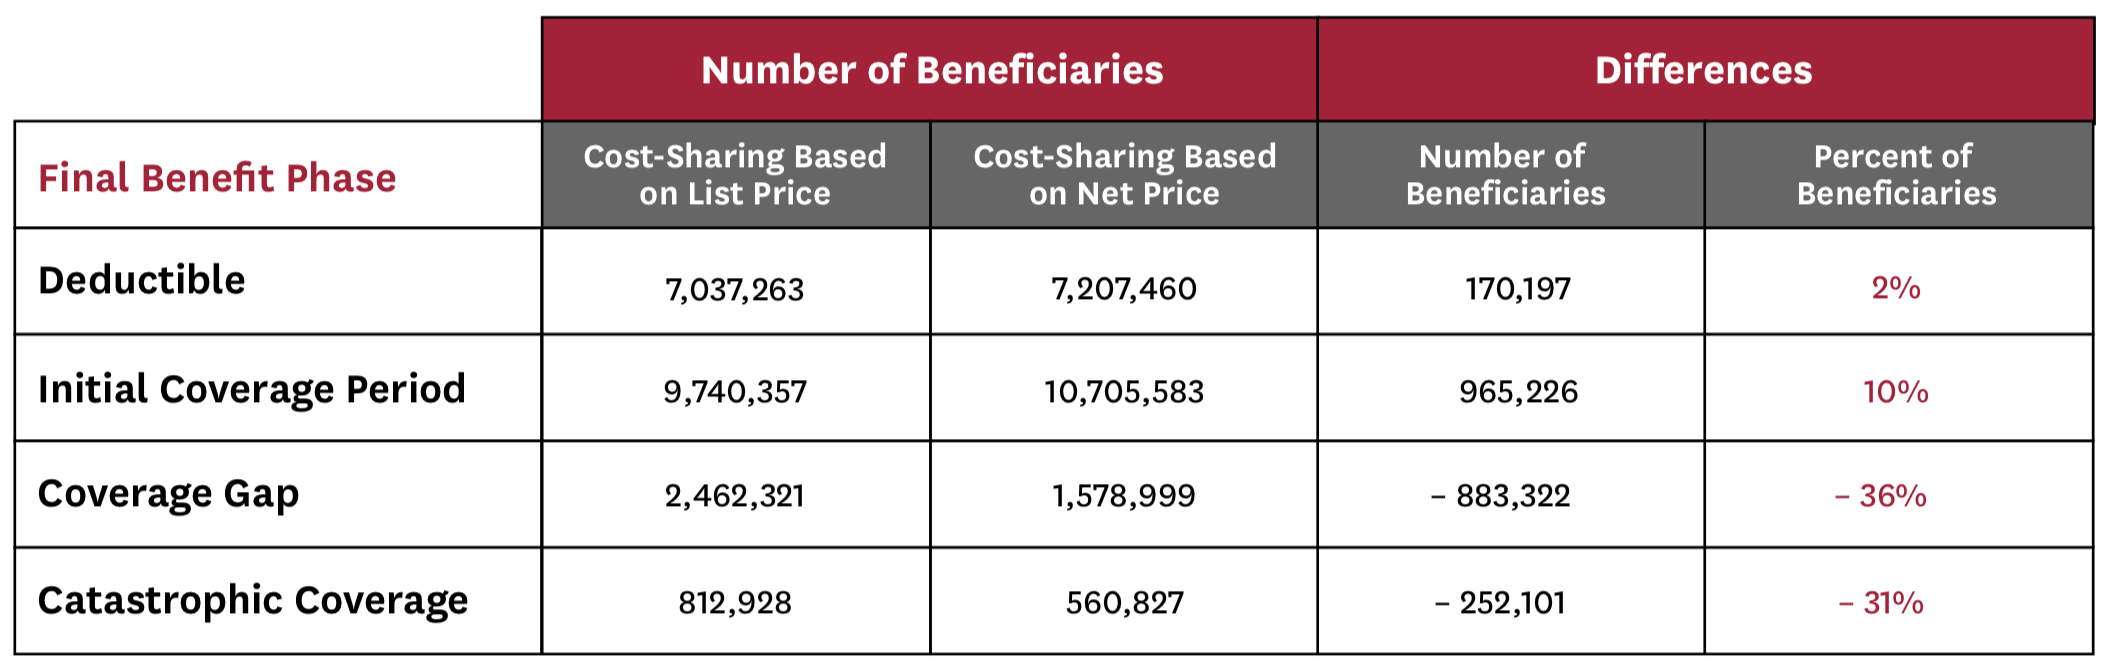
Finally, we find that tying cost-sharing (and total drug costs) to net price would have important implications for beneficiaries’ progression through the Part D benefit phases, which affects not only beneficiary spending, but also federal liability (Table 1). Specifically, this policy change reduces the total number of beneficiaries reaching both the coverage gap and catastrophic coverage phases by about one-third each. Moreover, it would reduce federal reinsurance spending (for our sample of non-LIS beneficiaries) by 19 percent, plan liability by 14 percent, and manufacturer-financed doughnut hole discounts by 36 percent.
Table 1: Impact of Net Price Policy on Beneficiaries’ Final Benefit Phase
Discussion
Rebates, as a share of total Part D spending, have increased considerably in recent years. While this rebate growth has helped to hold net drug spending and Part D premiums relatively steady, that has come at a cost to beneficiaries who take drugs with high list prices and large rebates, who face higher out-of-pocket spending than they would if cost-sharing instead reflected net prices. We find that the status quo – where beneficiary cost-sharing is based on list rather than net price – results in almost half of non-LIS beneficiaries paying more out-of-pocket, with nearly six percent of them paying more than $500 extra per year. It is possible that the distribution of the effect on beneficiaries’ out- of-pocket spending under Part D plans’ actual cost- sharing (rather than the standard benefit design) may differ – particularly if plans charge lower co-payments for drugs with higher rebates – but our results present a reasonable approximation to the overall expected changes from a net price policy.
These findings suggest that policies that would shift toward cost-sharing based on net, rather than list, price would provide meaningful financial relief to many Medicare beneficiaries. One example of such a policy would be a requirement that Part D plans share rebates with beneficiaries at the point-of-sale. While some have expressed concern that making rebates more transparent could result in higher net drug prices, policymakers could consider efforts – such as using estimated or aggregated rebates – that may help to alleviate these concerns. Moreover, the fact that many plans and pharmacy benefit managers have successfully implemented such changes in the commercial market suggests that such a policy change is both practically and operationally feasible.[20,21] However, absent a policy requiring Part D plans to implement such a change, it is unlikely that any individual plan could successfully do so voluntarily in the Part D market because doing so would raise its premiums relative to its competitors, and evidence suggests that beneficiaries are sensitive to premiums when selecting a Part D plan.[22,23] CVS did voluntarily introduce a new Part D plan last year – SilverScript Allure – that shared rebates with beneficiaries at the point of sale.[24] Perhaps not surprisingly, enrollment in this plan was very low, though it is unclear to what extent that reflects the plan’s high relative premium, broader lack of clarity for consumers, or general consumer inertia.25
A significant concern with basing out-of-pocket payments on net, rather than list, price is that Part D insurers would be forced to increase premiums or reduce benefits for their members. While estimating that effect is beyond the scope of this study (because we would need to incorporate spending changes among the entire sample of Part D beneficiaries, including LIS beneficiaries), we estimate elsewhere that basing cost-sharing on net price would result in a 13 percent increase in beneficiary-paid Part D premiums, or around $4.31 per member per month (using 2016 claims data with aggregate rebate estimates under the same set of assumptions regarding behavioral responses).[26] Thus, many beneficiaries would see premium increases that more than offset their reduced out-of-pocket spending, though we note that this is because a small share of beneficiaries are currently paying considerably higher out-of-pocket costs which subsidize these lower premiums for all beneficiaries today. Nonetheless, if policymakers are concerned that premium increases may result in some beneficiaries dropping coverage – or that this may drive adverse selection – they could consider phasing in these premium changes over time. Moreover, since cost-sharing for the Part D standard benefit design is based on list price, as rebates have grown, standard Part D coverage is becoming less generous relative to net prescription drug spending over time.
Our findings also indicate that basing cost-sharing on net price would have an important impact on the number of beneficiaries who reach catastrophic coverage. While analysts have previously highlighted high list prices’ role in accelerating beneficiaries’ progression through the benefit phases,[27] here we show that approximately one-third of non-LIS beneficiaries who reached catastrophic coverage under the status quo would not have done so had cost-sharing instead been based on net price. Moreover, federal reinsurance spending on these beneficiaries would have been 19 percent lower.While it is possible that the Part D benefit design parameters and thresholds would be different under a net price policy, it is striking to see the role that growing list prices have played in the acceleration of the share of Part D spending occurring in catastrophic coverage in recent years.[28] These findings suggest that a policy change tying cost-sharing to net price could also have broader impacts on the overall distribution of Part D spending.
The net impact of such a policy change on federal spending would depend on the relative balance between increased federal liability for premium subsidies and decreased federal liability for low-income cost-sharing subsidies and reinsurance subsidies. While we do not model behavioral responses here, the net impact of such a policy change would also reflect these responses. For example, such a policy could potentially result in increased drug utilization by beneficiaries who face lower cost-sharing (which may have positive health benefits). Using net, rather than list, price would also affect incentives for plans, pharmacy benefit managers, and other intermediaries, which could affect plan formulary, benefit design, and pricing. The details of a policy change would be particularly important in this regard. For example, it would be important for Part D plans to maintain their ability to set varied co-payment amounts (rather than be required to specifically use the standard benefit design based on net price) so as not to abate their (or their pharmacy benefit managers’) negotiating leverage.
Conclusion
The growing divergence between list and net prices in Medicare Part D has created considerable distortions, with some beneficiaries paying more out-of-pocket to subsidize premiums for all beneficiaries. We find that a policy change that would base cost-sharing on net, rather than list, price would result in considerable financial relief for a large number of Medicare beneficiaries. Moreover, it would slow the progression of all beneficiaries though the benefit phases, with one- third of beneficiaries who are reaching catastrophic coverage under the current system no longer doing so when cost-sharing is based on net price. Policymakers should consider implementing such a change – perhaps in conjunction with other market reforms – to help restore effective competition and a more equitable distribution of out-of-pocket spending in the Part D market.
Footnotes
[i] We define employer plan enrollment according to the monthly contract number and Retiree Drug Subsidy variables in the Master Beneficiary Summary File; anyone who is in an employer-sponsored plan for one or more months during 2016 is excluded from the sample. We also exclude claims from beneficiaries who are enrolled in a special needs plan (SNP), defined according to the plan information on the individual claim; any claims associated with a SNP, or any plan that is not a PDP or MA-PD are dropped from analysis, and we only count the spending for the claims associated with valid plans.
[ii] We calculate the total list price according to the total gross drug cost variables included in the claims data. In actuality, other payers not described here may pay some portion of certain claims, making up a very small share of overall Part D spending. While these payments are included in the calculation of the list price of each claim, we do not model them as payers in either of our re-processed scenarios. That is, we assume that their liability is assumed by beneficiaries, plans, manufacturers, or reinsurance according to the standard benefit design parameters.
[iii] We thank Brad Gambill and Lev Peysekhman of Flipt Rx for sharing these rebate estimates with us.
[iv] We thank Murray Aitken and Allen Campbell of the IQVIA Institute for Human Data Science for providing us with their classification of specialty drugs and Anna Anderson-Cook for helpful communication regarding replicating CBO’s exercise in applying IQVIA’s specialty drug definition to the Part D claims.
[v] 53.3 percent of beneficiaries would have no change in out-of-pocket spending under this policy, while less than 0.2 percent would see an increase in out-of-pocket spending. The latter is possible if spending on generics increases as a share of total spending occurring in the coverage gap phase, because manufacturer-financed discounts are available only on branded drugs and apply toward TrOOP, but are not actually paid out-of-pocket by the beneficiary. Among the 53.3 percent with no change in out-of-pocket spending, 12 percent of them (about 6 percent of all non-LIS beneficiaries) have no claims, 52 percent have claims for generic drugs only, and 36 percent have at least one claim for a branded drug, but all of their branded drug claims have zero estimated rebates.
References
- Blendon RJ, Kenen J, Benson JM, Sayde JM. Politico and Harvard T.H. Chan School of Public Health. Americans’ Priorities for the New Congress in 2019. 2018; https://www.politico.com/f/?id=00000168-1450-da94-ad6d- 1ffa86630001.
- Hernandez I, et al. The Contribution of New Product Entry Versus Existing Product Inflation in the Rising Costs of Drugs. Health Affairs 38, No. 1 (2019): 76-83.
- Kirzinger A, Lopes L, Wu B, Brodie M. KFF Health Tracking Poll – February 2019: Prescription Drugs. Kaiser Family Foundation 2019; https://www.kff.org/health-costs/poll-finding/kff-health-tracking-poll-february-2019-prescription- drugs/.
- United States Government Accountability Office. Medicare Part D: Use of Pharmacy Benefit Managers and Efforts to Mange Drug Expenditures and Utilization. July 2019. https://www.gao.gov/assets/710/700259.pdf
- Medicare Payment Advisory Commission. Sharing risk in Medicare Part D. June 2015. http://www.medpac.gov/docs/ default-source/reports/chapter-6-sharing-risk-in-medicare-part-d-june-2015-report-.pdf
- Dusetzina SB, Conti RM, Yu NL, Bach PB. Association of Prescription Drug Price Rebates in Medicare Part D With Patient Out-of-Pocket and Federal Spending. JAMA Internal Medicine 2017;177(8):1185-1188.
- 2019 Annual Report of the Boards of Trustees of the Federal Hospital Insurance and Federal Supplementary Medical Insurance Trust Funds. Table IV.B8. Available: https://www.cms.gov/Research-Statistics-Data-and-Systems/Statistics- Trends-and-Reports/ReportsTrustFunds/Downloads/TR2019.pdf
- IQVIA Report. https://www.iqvia.com/institute/reports/medicine-use-and-spending-in-the-us-review-of-2017-outlook- to-2022
- Health and Human Services. 42 CFR Part 1001. Fraud and Abuse; Removal of Safe Harbor Protection for Rebates Involving Prescription Pharmaceuticals and Creation of New Safe Harbor Protection for Certain Point- of-Sale Reductions in Price on Prescription Pharmaceuticals and Certain Pharmacy Benefit Manager Service Fees. February 6, 2019. Available: https://www.regulations.gov/contentStreamer?documentId=HHSIG-2019-0001- 0001&contentType=pdf
- Congressional Budget Office. Incorporating the Effects of the Proposed Rule on Safe Harbors for Pharmaceutical Rebates in CBO’s Budget Projections – Supplemental Material for Updated Budget Projections: 2019 to 2029. May 2019. Available: https://www.cbo.gov/system/files/2019-05/55151-SupplementalMaterial.pdf
- US Senate – Prescription Drug Pricing Reduction and Health and Human Services Improvement Act of 2019. Available: https://www.finance.senate.gov/imo/media/doc/Prescription%20Drug%20Pricing%20Reduction%20and%20 Health%20and%20Human%20Services%20Improvements%20Act.pdf
- US House of Representatives 3 – Lower Drug Costs Now Act of 2019. Available: https://www.congress.gov/bill/116th- congress/house-bill/3 Accessed November 14, 2019.
- Grassley C. Prepared Opening Remarks. Markup for The Prescription Drug Pricing Reduction Act of 2019. July 25, 2019. Available: https://www.finance.senate.gov/chairmans-news/grassley-on-the-prescription-drug-pricing-reduction- act-of-2019
- Cubanski J, Rae M, Young K, Damico A. How Does Prescription Drug Spending and Use Compare Across Large Employer Plans, Medicare Part D, and Medicaid? Kaiser Family Foundation, May 20, 2019. Available: https://www.kff. org/medicare/issue-brief/how-does-prescription-drug-spending-and-use-compare-across-large-employer-plans-medi- care-part-d-and-medicaid/
- Credit Suisse. Rising US Rebates Limit Margin Expansion. May 1, 2015. Available: https://plus.credit-suisse.com/rpc4/ ravDocView?docid=NyXspc
- Johnson NJ, Mills CM, Kridgen M. Prescription Drug Rebates and Part D Drug Costs. Milliman Report. July 16, 2018. Available: https://www.ahip.org/wp-content/uploads/2018/07/AHIP-Part-D-Rebates-20180716.pdf
- 2019 Annual Report of the Boards of Trustees of the Federal Hospital Insurance and Federal Supplementary Medical Insurance Trust Funds. Table IV.B8. Available: https://www.cms.gov/Research-Statistics-Data-and-Systems/Statistics- Trends-and-Reports/ReportsTrustFunds/Downloads/TR2019.pdf
- Centers for Medicare and Medicaid Services. 2014 Part D Rebate Summary for All Brand Name Drugs. Available: https://www.cms.gov/Research-Statistics-Data-and-Systems/Statistics-Trends-and-Reports/Information-on- Prescription-Drugs/PartD_Rebates.html
- Anderson-Cook A, Maeda J, Nelson L. Prices for and Spending on Specialty Drugs in Medicare Part D and Medicaid: An In-Depth Analysis. Congressional Budget Office Working Paper 2019-02. March 2019. Available: https://www.cbo. gov/system/files/2019-03/55011-Specialty_Drugs_WP.pdf
- Optum. Point of Sale Discounts Mean Lower Costs. Available: https://www.optum.com/resources/library/point-of-sale. html
- CVSHealth. CVS Health Introduces New Approach to Pricing of Pharmacy Benefit Management Services. Available: https://cvshealth.com/newsroom/press-releases/cvs-health-introduces-new-approach-pricing-pharmacy-benefit-manage- ment
- Heiss F, Leive A, McFadden D, Winter J. Plan selection in Medicare Part D: Evidence from administrative data. J Health Econ 2013 Dec; 32(6): 1325-1344.
- Abaluck JT, Gruber J. Choice inconsistencies among the elderly: Evidence from plan choice in the Medicare Part D pro- gram. Am Econ Rev 2011; 101: 1180-1210.
- CVSHealth. SilverScript Insurance Company, a CVS Health Company, Introduces Three Medicare Prescription Drug Plan Options for 2019. October 1, 2018. Available: https://cvshealth.com/newsroom/press-releases/silverscript-insur- ance-company-cvs-health-company-introduces-three-medicare
- Lupkin S. Consumers Rejected Drug Plan that Mirrors Trump Administration Proposal. Kaiser Health News, April 9, 2019. Available: https://khn.org/news/consumers-rejected-drug-plan-that-mirrors-trump-administration-proposal/
- Trish E. Medicare Part D: Time for Re-Modernization? Health Serv Res 2019; 54: 1174-1183.
- MedPAC. Report to the Congress: Restructuring Medicare Part D for the Era of Specialty Drugs. June 2019. Available: http://medpac.gov/docs/default-source/reports/jun19_medpac_reporttocongress_sec.pdf ?sfvrsn=0
- Trish E, Xu J, Joyce GF. Growing number of unsubsidized Part D beneficiaries with catastrophic spending suggests need for an out-of-pocket cap. Health Aff 2018 Jul; 37(7): 1048-1056.
You must be logged in to post a comment.