Editor’s Note: This analysis is part of the USC-Brookings Schaeffer Initiative for Health Policy, which is a partnership between Economic Studies at Brookings and the University of Southern California Schaeffer Center for Health Policy & Economics. The Initiative aims to inform the national healthcare debate with rigorous, evidence-based analysis leading to practical recommendations using the collaborative strengths of USC and Brookings.
The COVID-19 pandemic is causing large shifts in health care delivery as hospitals and physicians mobilize to treat COVID-19 patients and defer nonemergent care. These shifts carry major financial implications for providers, payers, and patients. This analysis seeks to quantify one dimension of these financial consequences: the amounts that will be spent on direct COVID-19 care in the U.S.
Projecting spending on COVID-19 care is difficult because much about the disease and its future course is uncertain. Two dimensions of uncertainty loom particularly large for this analysis: (1) what share of people will ultimately be infected with SARS-Cov-2, the virus that causes COVID-19; and (2) what share of infected people will be hospitalized in the U.S. In light of this uncertainty, this analysis presents a range of spending estimates that reflect the uncertainty along both of these dimensions.
In brief, we consider two nationwide cumulative infection rates: 5 percent (which roughly corresponds to a scenario in which infections are, on average, driven to a low level over the coming weeks and there is no substantial “second wave” of infections) and 60 percent (which corresponds to poorly controlled spread of the virus, including scenarios with a large “second wave”). We then consider a range of hospitalization rates among people infected with SARS-Cov-2. In our base estimates, we use age-specific hospitalization rates derived from an analysis of recently reported data for New York City, which imply a 1.9 percent hospitalization rate on average across the U.S. age distribution. To reflect the uncertainty around these base estimates, we also consider hospitalization rates ranging from half as large to twice as large.
Our analysis does not account for how new COVID-19 treatments—including remdesivir, for which some encouraging preliminary data were released on April 29—might affect spending. In general, these treatments could add additional spending, but could also generate offsetting savings, notably by reducing the duration or intensity of hospitalizations. We leave estimating these effects to future work.
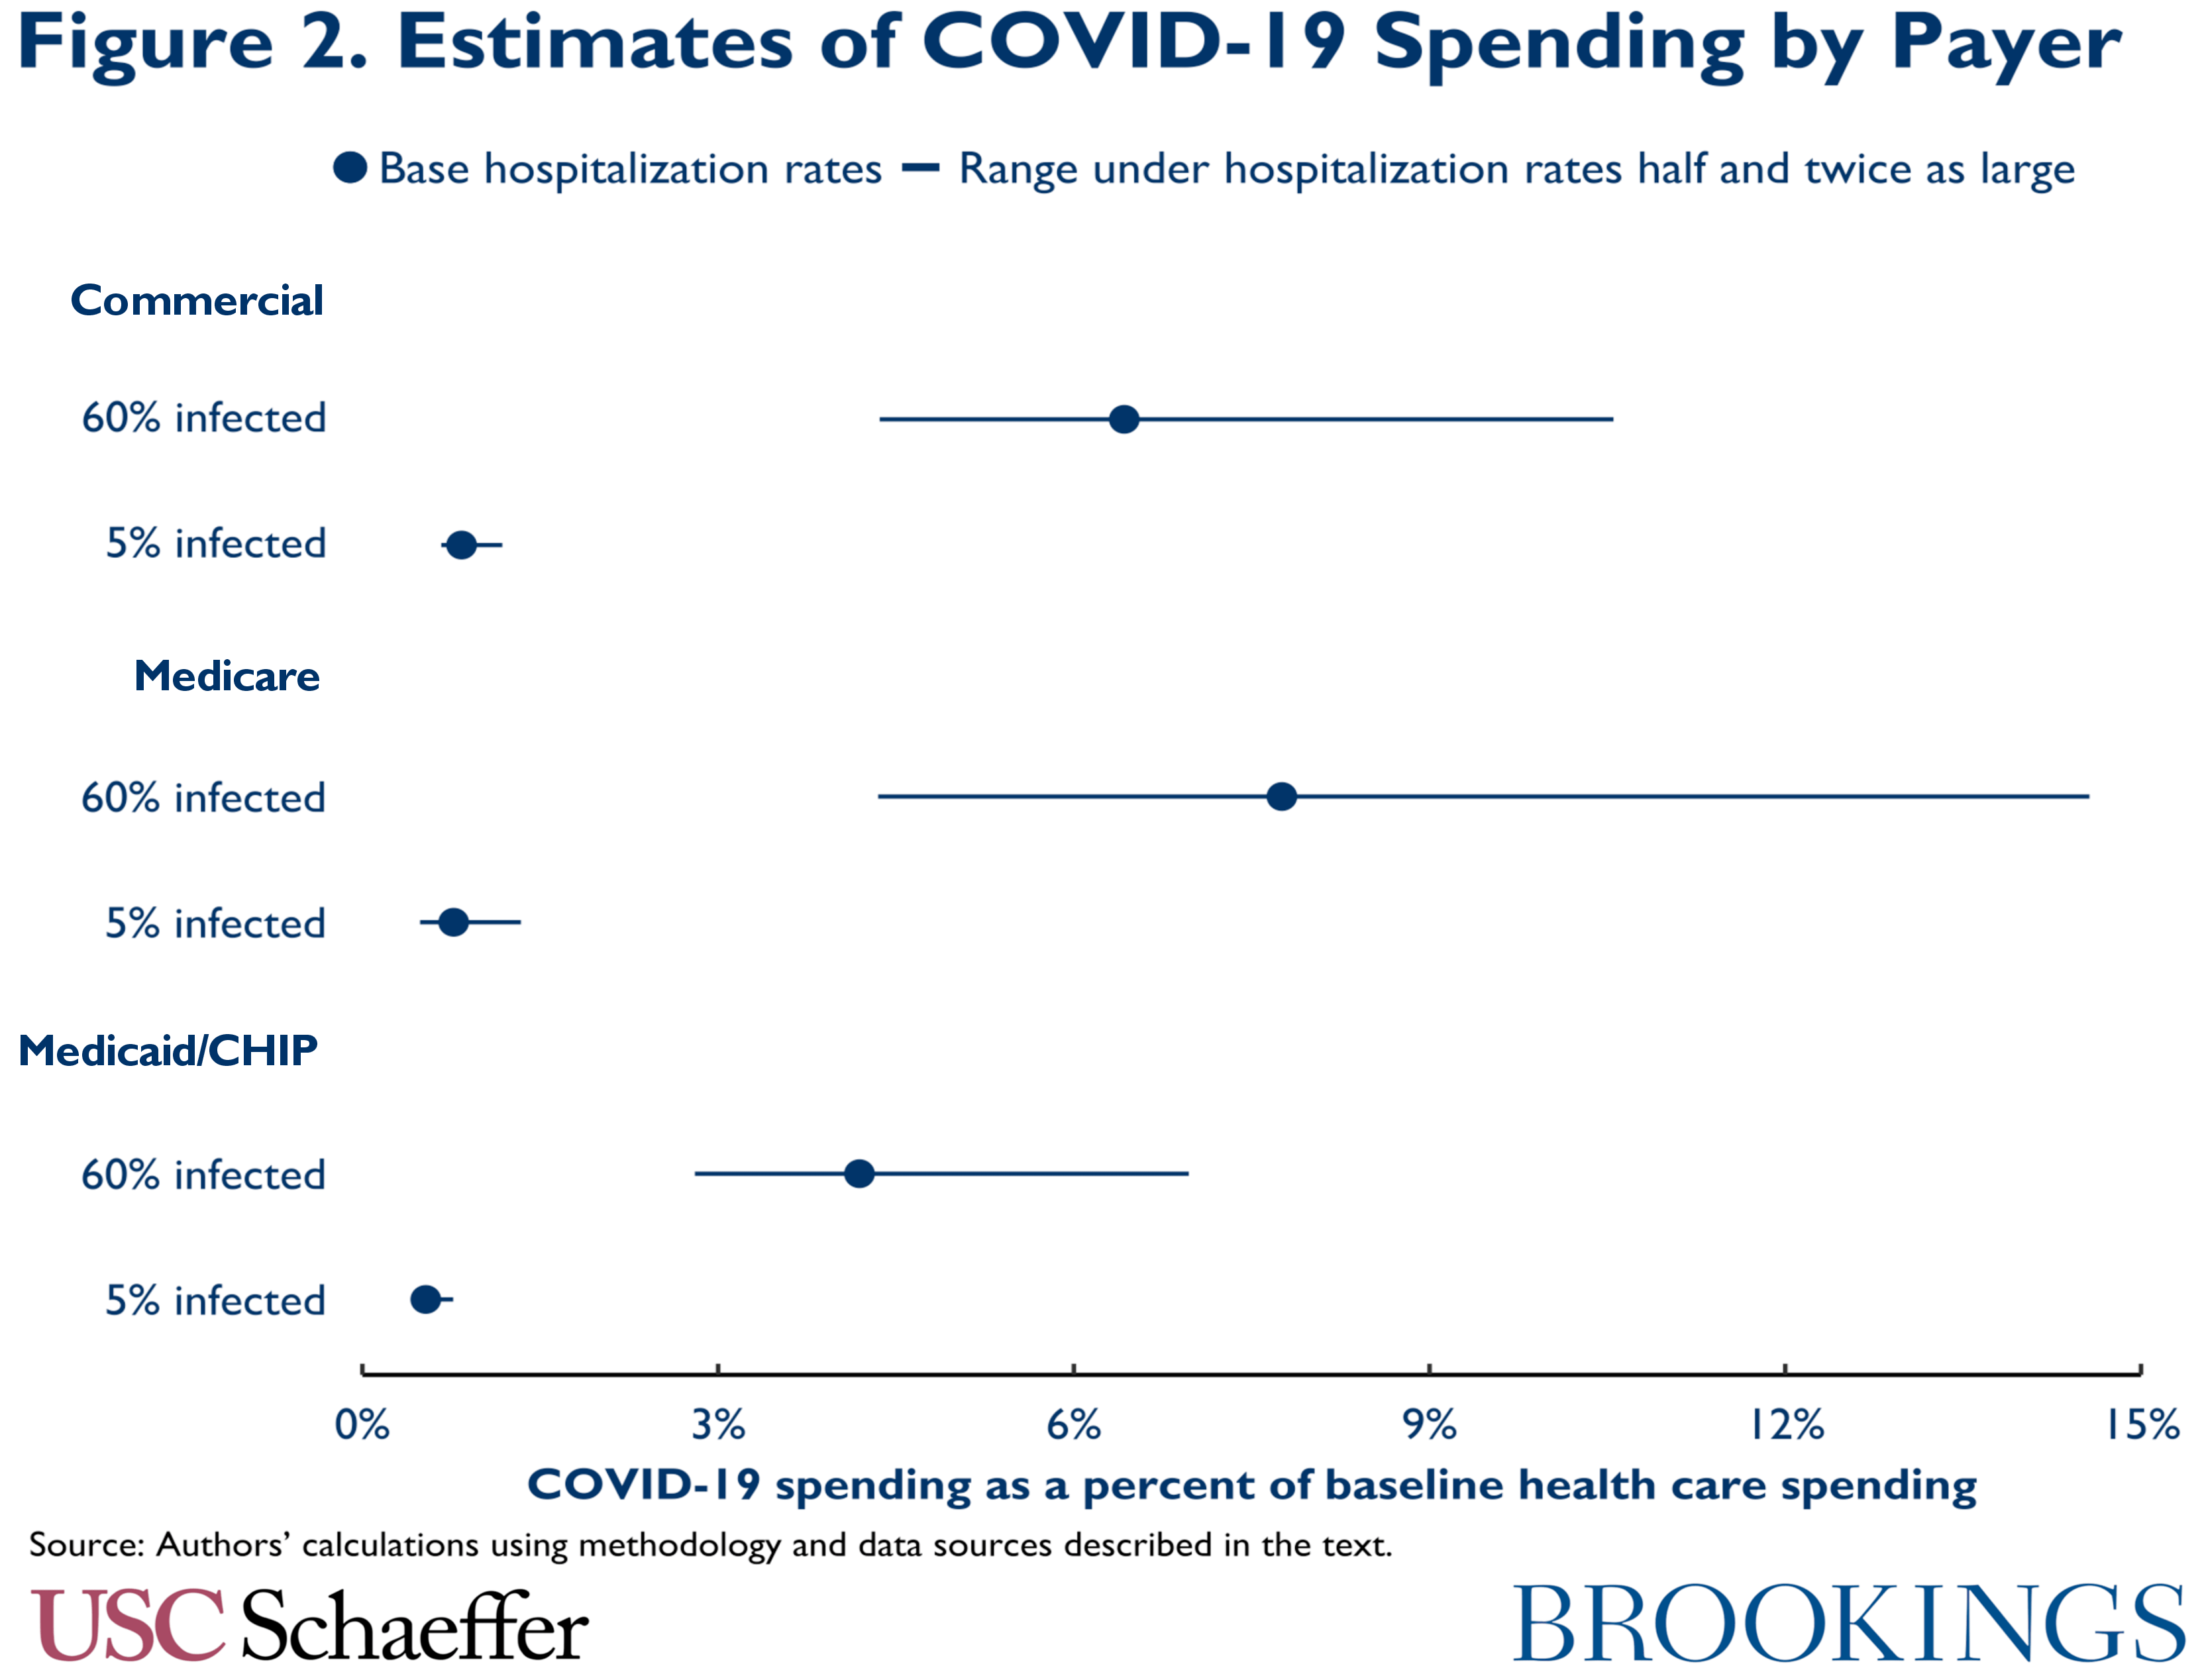
Turning to our estimates, if 5 percent of the U.S. population is ultimately infected, we estimate that aggregate spending on COVID-19 care will be relatively modest. Even if infected people are hospitalized at the highest rates we consider, aggregate COVID-19 spending would be only 1.0 percent of baseline health care spending, as illustrated in Figure 1. (Here and throughout, we use the phrase “baseline health care spending” to refer to the spending projected for 2020 prior to the emergence of COVID-19.) COVID-19 spending is only 1.3 percent of baseline spending among people with Medicare, 1.2 percent of baseline sending among people with commercial insurance, and 0.7 percent of baseline spending for people covered by Medicaid and the Children’s Health Insurance Program (CHIP), as illustrated in Figure 2.
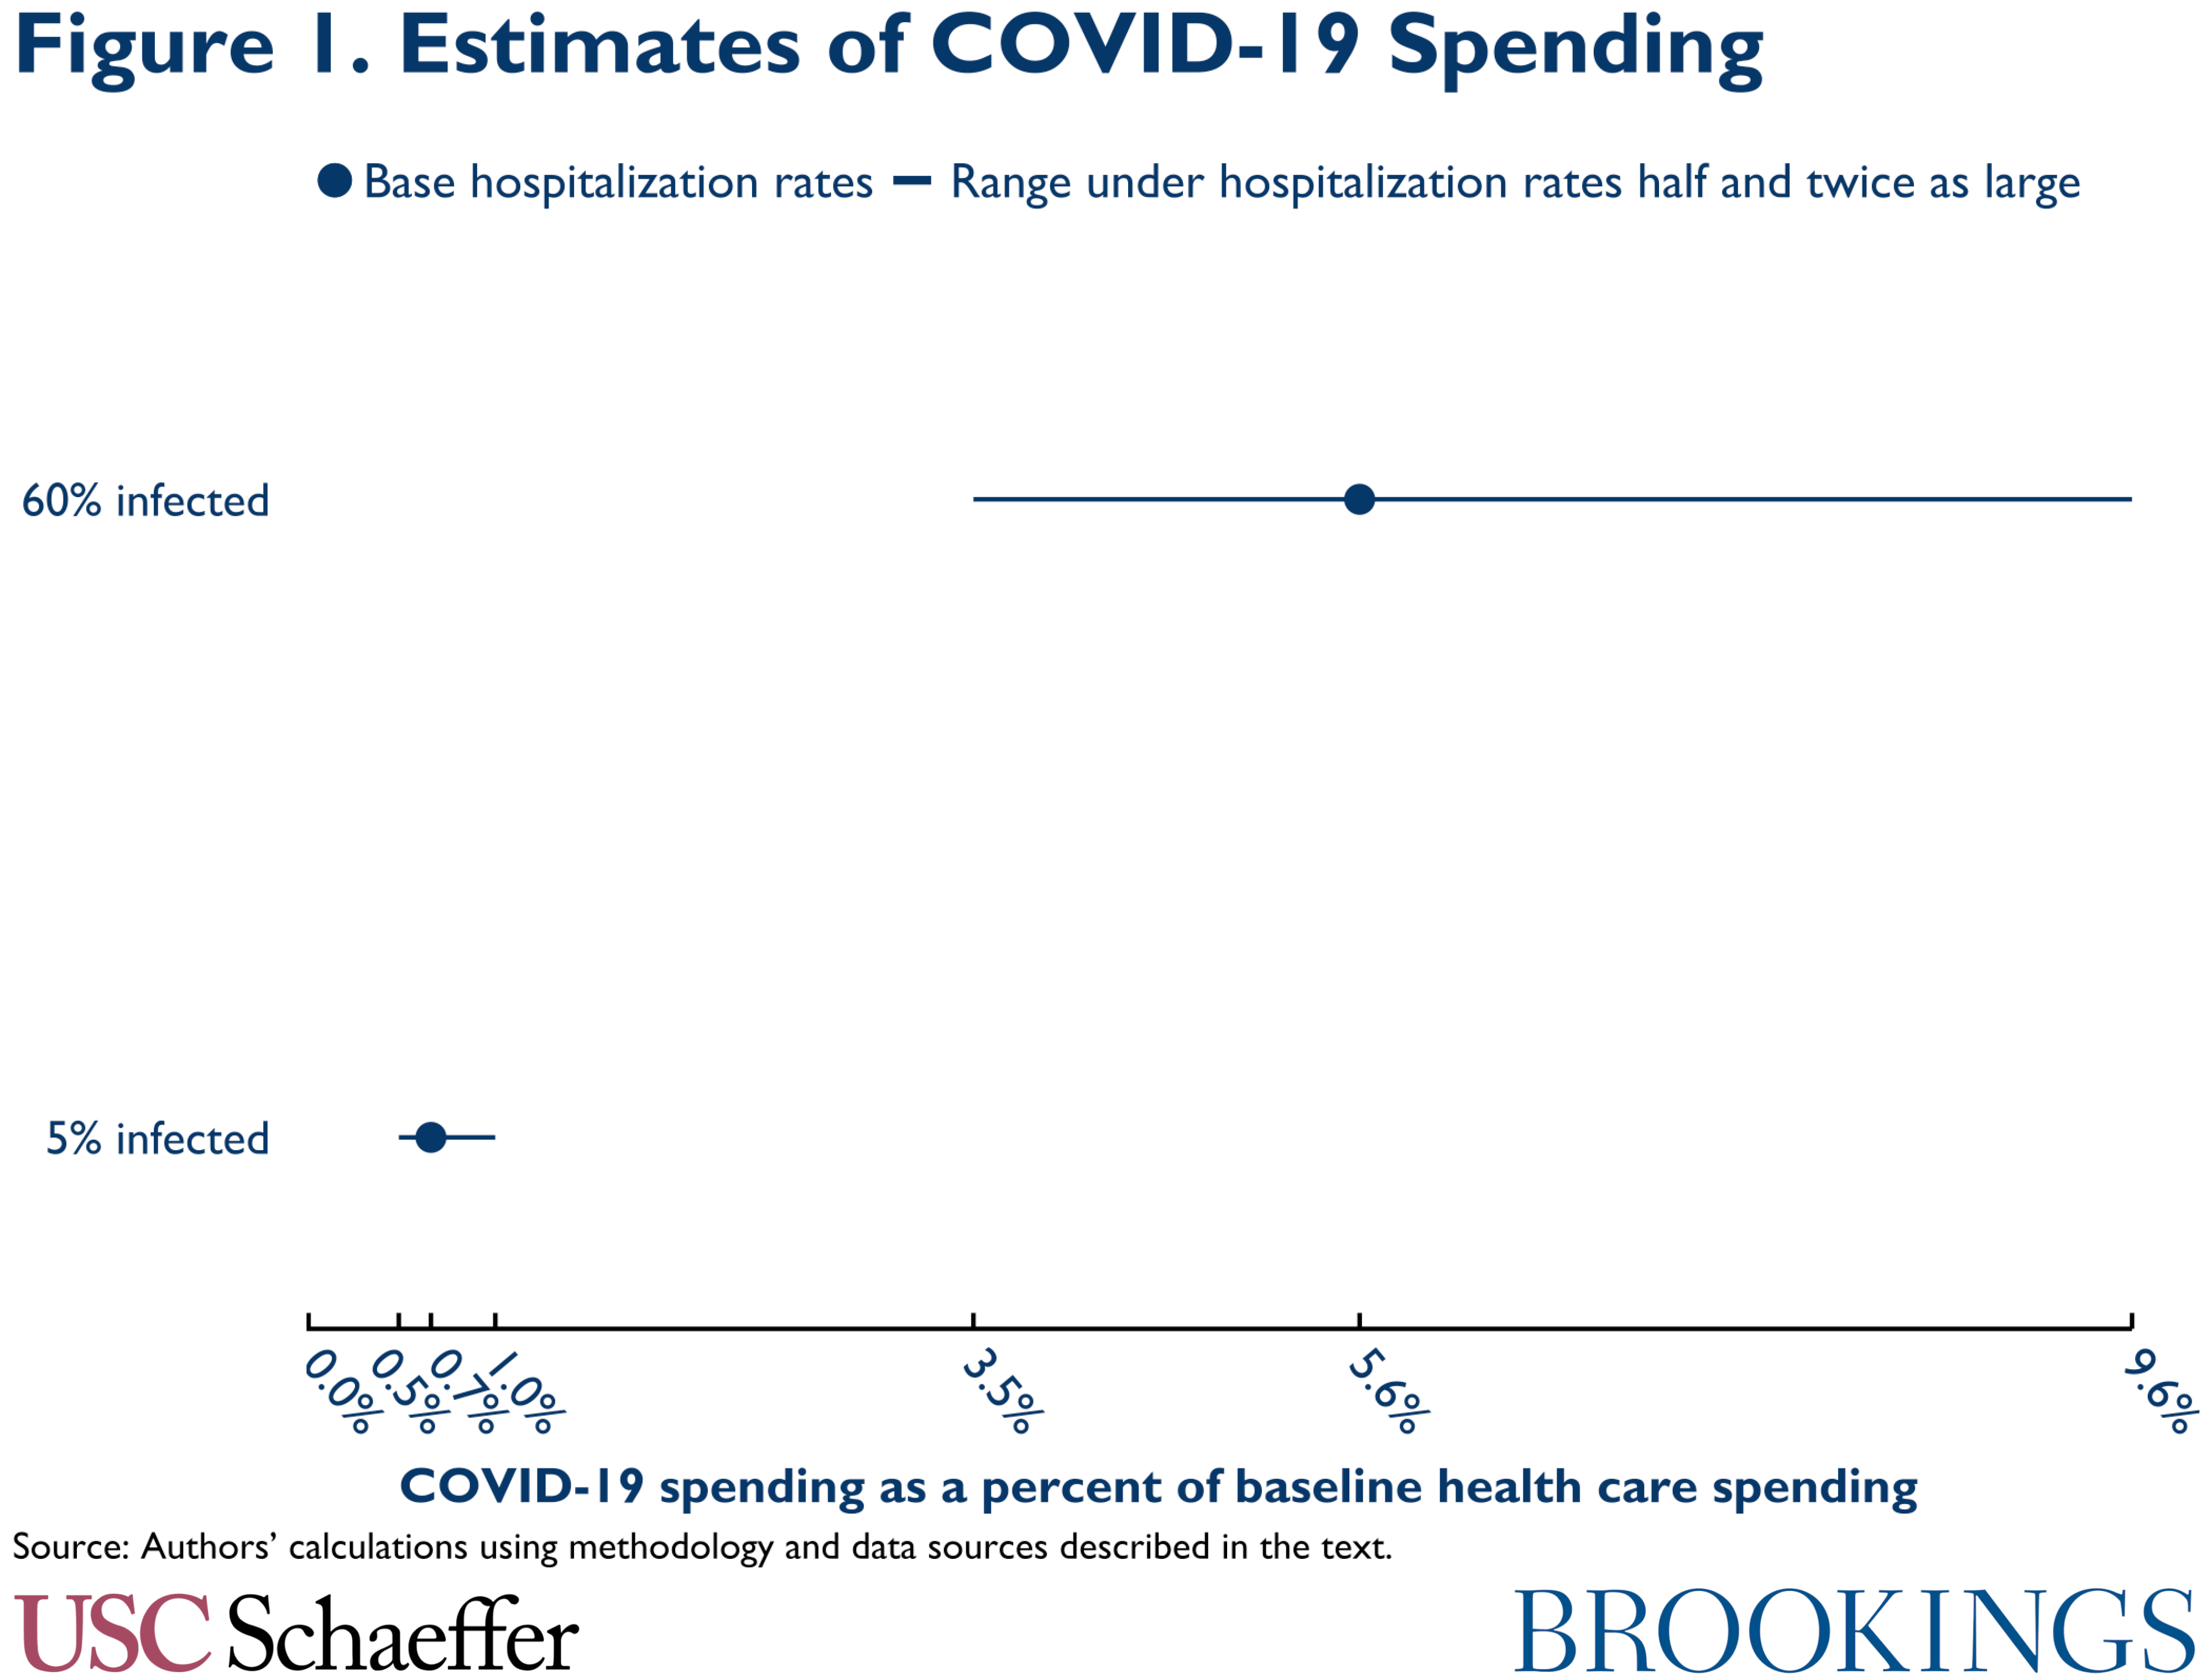
With a higher infection rate, spending is correspondingly higher. If 60 percent of people are infected and our base hospitalization rates prevail, we estimate aggregate COVID-19 spending would equal 5.6 percent of baseline health care spending, with payer-specific estimates of 7.8 percent in Medicare, 6.4 percent in commercial coverage, and 4.2 percent in Medicaid/CHIP. With higher infection rates, estimated spending is much more sensitive to hospitalization rates, ranging from 3.5 percent of baseline spending under our lowest hospitalization rates to 9.6 percent of baseline spending under our highest hospitalization rates.
The moderate size of COVID-19 spending in our estimates can help explain why the arrival of COVID-19 has been associated with a large decline in overall health care spending. The cumulative share of people who have been infected with SARS-Cov-2 is likely still close to or below 5 percent nationally, although there continues to be considerable uncertainty about the number of undetected infections. Our base hospitalization rate estimates then imply that direct COVID-19 spending to date amounts to about 0.7 percent of (annual) baseline health care spending or less. A reduction in the flow of non-COVID-19 care of about 8 percent that lasted for one month would be sufficient to offset that impact. Yet it seems clear that the actual amount of non-COVID-19 care currently being deferred is far larger than that.
It is thus not surprising that a recent informal survey of insurers concluded that their overall claims spending was down by around 30 percent over the last month and that several publicly traded insurers have cited similar estimates when briefing shareholders. It also suggests that if even a relatively modest portion of the care deferred in response to COVID-19 is not ultimately rescheduled (and future periods of high SARS-Cov-2 transmission continue to induce substantial deferral of non-COVID-19 care), then COVID-19 will reduce most payers’ 2020 claims spending on net.
At the end of this analysis, we discuss the implications that our estimates and this other evidence have for recent insurance industry requests for federal aid to offset COVID-19 costs. We conclude that the rationale for providing aid to insurers for COVID-19 costs incurred during the 2020 plan year is quite weak since premiums for the 2020 plan year are already set, so such aid would function entirely or at least primarily as a windfall to insurers. Looking ahead to 2021, we conclude that uncertainty created by COVID-19 could put upward pressure on premiums for the 2021 plan year, which might merit a federal response, but that any federal action should be specifically tailored toward mitigating that uncertainty.
The remainder of this analysis proceeds as follows. We first describe our methodology for estimating spending on COVID-19 care and present our results. We then discuss how the pandemic may be affecting non-COVID-19 care and providers’ bottom lines. We close by examining what our results imply about recent insurance industry requests for COVID-19-related aid. Appendix A describes how we derive the hospitalization rates used in our analysis, Appendix B describes how we calculate baseline health care spending, and Appendix C provides more detailed estimates.
Estimation Methodology
We estimate total payments for hospitalizations, outpatient visits, and COVID-19 testing that will occur in the U.S., and we do so separately for people with Medicare, Medicaid/CHIP, and commercial insurance, as well as the uninsured. Total spending by people with each coverage type depends on: (1) the number of people with that coverage type; (2) the quantity of COVID-19 services each person uses, which depends in turn on how broadly the coronavirus spreads; and (3) the unit prices of those services.
We use the 2018 National Health Interview Survey (NHIS) to estimate how many people have each coverage type and do so separately by age, allowing us to vary hospitalization rates by age.[1] While the distribution of coverage types will likely shift to some degree as employment declines, we believe that those shifts will likely have only modest effects on our estimates. The remainder of this section discusses our assumptions about infection rates, utilization of inpatient and outpatient services, and the unit prices of services. We then discuss some limitations of our methodology.
Infection Rate Scenarios
We analyzed two scenarios for how many people would ultimately be infected with SARS-Cov-2:
- Successful suppression: This scenario assumes a 5 percent infection rate. It can be viewed as roughly reflecting a scenario in which some combination of social distancing, intensive testing and contact tracing, and other measures drive the number of active infections from their current level to near zero over the next several weeks and successfully prevent a large “second wave” of infections. We note that there is no guarantee that this outcome can be achieved in practice.
- Broad spread: This scenario assumes a 60 percent infection rate. It can be viewed as reflecting what would occur if the spread of SARS-Cov-2 were relatively poorly controlled, either now or in subsequent waves. If early estimates of the virus’ transmissibility are correct, this infection rate is at or modestly above the level that would confer “herd immunity” in standard epidemiological models.[2] However, achieving this infection rate might still require policymakers and the public to take some steps to slow transmission (albeit much less aggressive steps than in the preceding scenario) since those models predict that completely unmitigated spread will cause cumulative infection rates to overshoot the herd immunity level.
In both scenarios, we assume that the share infected is constant across people of different ages and with different types of coverage. For context, as of April 29, about 0.3 percent of the U.S. population had a confirmed COVID-19 diagnosis. However, the true number of cases is surely higher, most likely by an order of magnitude or more, since many people infected with SARS-Cov-2 have not been tested.
Utilization of Inpatient Services
Hospitalization rates for people infected with SARS-Cov-2 are uncertain because there is considerable uncertainty about how many people have been infected with SARS-Cov-2. In light of this uncertainty, we consider three hospitalization rates for each of the two infection rate scenarios described above.
To construct hospitalization rates, we use data for New York City, which has seen the largest number of COVID-19 cases in the U.S. We first estimate the number of New York City residents who have been infected with SARS-Cov-2. To do so, we use data reported by Sutton and colleagues on the results of universal SARS-Cov-2 testing among women presenting for delivery at a pair of hospitals in New York City. Following the methodology described in Appendix A, we convert Sutton and colleagues’ estimate of the share of women testing positive for SARS-Cov-2 during the March 22 to April 4 period examined in their study to an estimate of the cumulative SARS-Cov-2 infection rate; we then adjust for geographic differences between this population and the population of New York City as a whole.
Based on this approach, we estimate that approximately 20 percent of New York City residents had been infected as of April 4; this estimate is broadly consistent with estimates of cumulative infection rates from a serology survey conducted by New York State (although many details of how and when the state conducted its survey are not available). To estimate hospitalization rates, we then compare the estimated number of infected people implied by this infection rate to the number of COVID-19 hospitalizations by age reported by the New York City Department of Health and Mental Hygiene.
There are several key uncertainties embedded in these calculations, which are discussed at greater length in Appendix A. Notably, the sample of pregnant women studied by Sutton and colleagues may not be representative of New York City as a whole, even after our adjustments. Additionally, there are a variety of imperfections in the available data, and our approach relies on simplifying assumptions about how SARS-Cov-2 infections evolve. Hospitalization patterns for New York City could also be an imperfect guide to what may occur in the rest of the U.S.
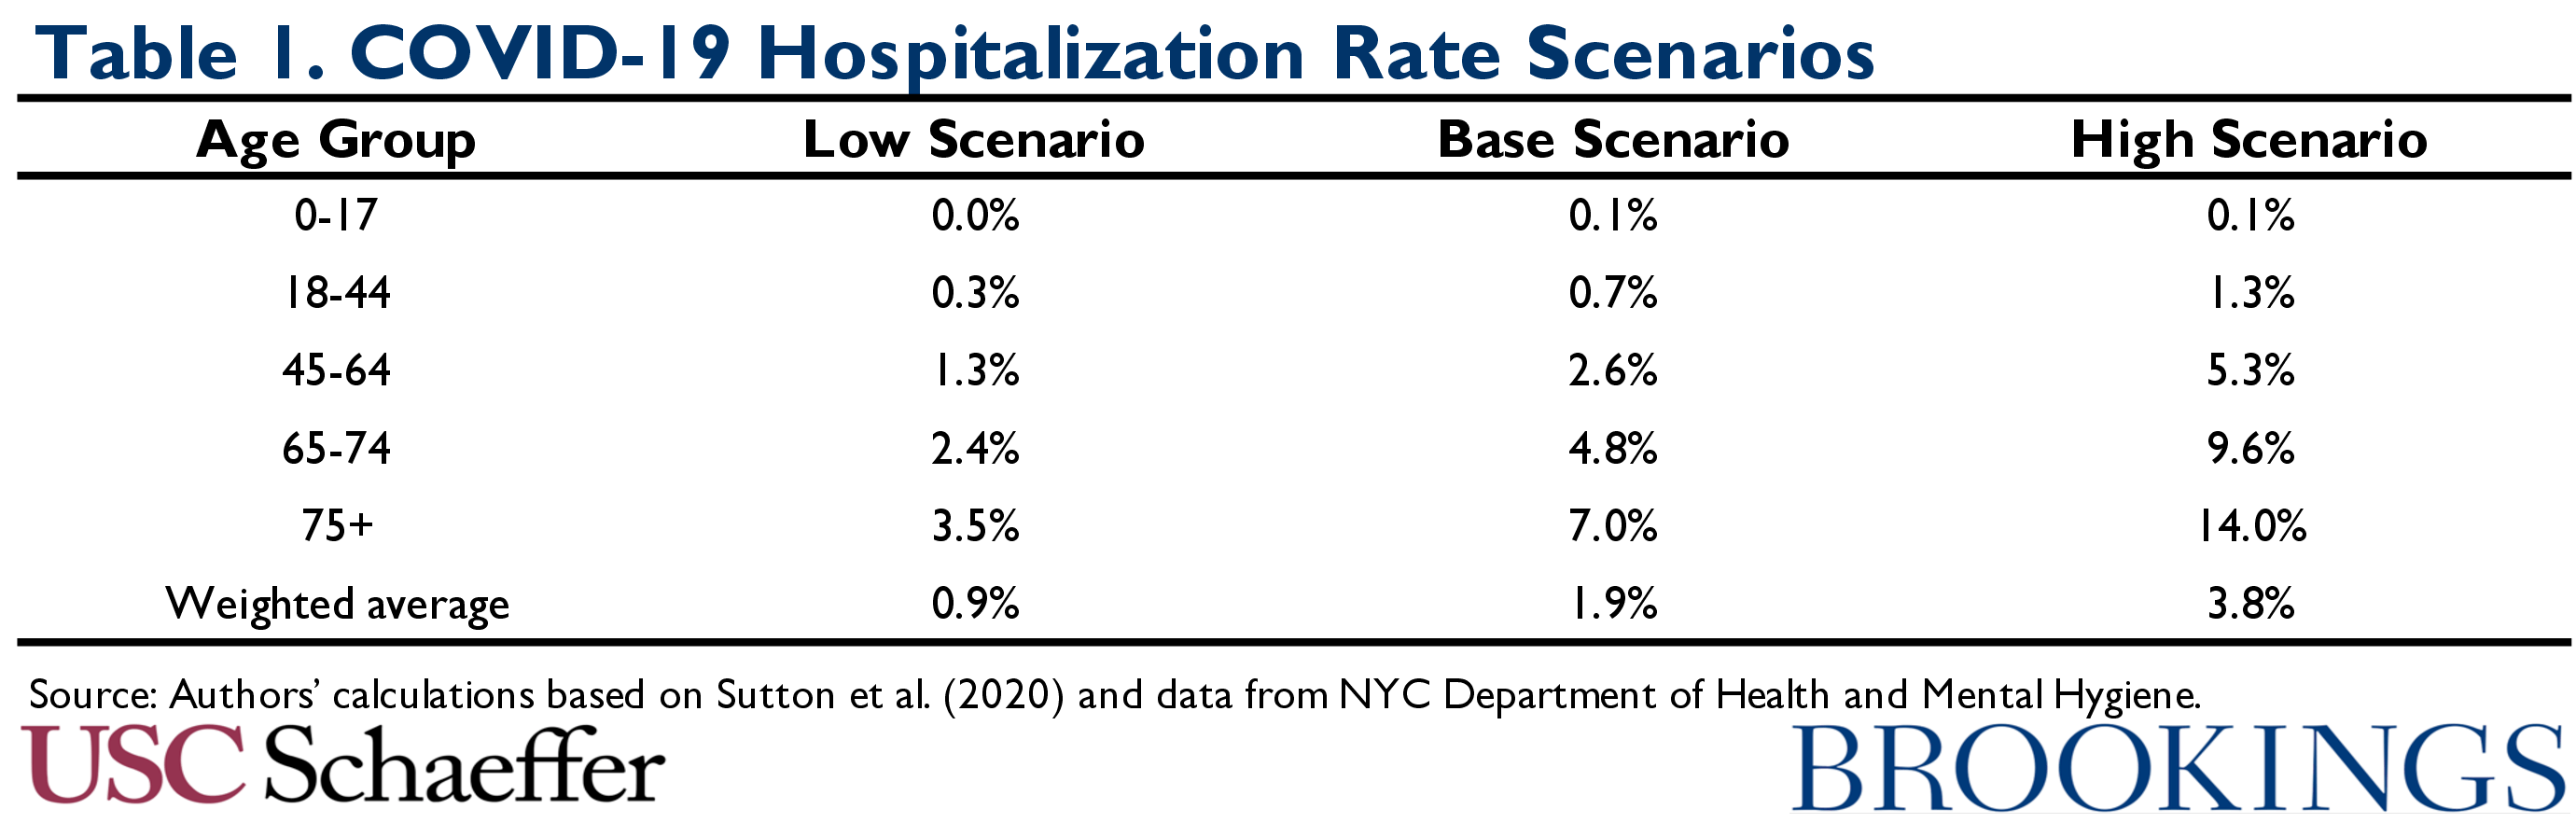
Thus, in addition to presenting a base case using our point estimate, which represents our educated guess based on the available data, we also examine hospitalization rates that are twice as large and half as large. While this approach is admittedly somewhat ad hoc, we believe that the true hospitalization rates are reasonably likely to fall somewhere in the range spanned by our scenarios. The resulting hospitalization rates, which increase sharply with age, are summarized in Table 1.
We note that these hospitalization rates are all much lower than those reported in a pair of publications from the Centers for Disease Control (CDC), which have been used in other recent analyses of the potential costs of COVID-19 treatment. Those CDC analyses reported hospitalizations as a share of people with laboratory-confirmed COVID-19. Because many people with milder cases of COVID-19 are never definitively diagnosed, this approach greatly overstates hospitalization rates. Our estimates are also lower than estimates reported by Verity and colleagues that do adjust for under-ascertainment of mild cases of COVID-19. As discussed in Appendix A, it appears that their estimates, which are based on data from China, overstate what share of infections will be hospitalized in a U.S. context.
Even within an age group, it is generally believed that people with underlying health conditions are at greater risk of hospitalization if they contract COVID-19. Health status varies by coverage type, so this pattern is likely to affect how COVID-19 hospitalizations are distributed across payers. As a crude way of capturing this pattern, we distributed the total number of hospitalizations in each age group across payers under the assumption that the risk of COVID-19 hospitalization varied proportionally with overall hospitalization rates, as estimated using the 2018 National Health Interview Survey.[3] This adjustment more than doubles the number of hospitalization borne by Medicaid/CHIP and increases the number of hospitalizations borne by Medicare by 14 percent, but reduces the number of hospitalizations among people with commercial coverage or who are uninsured by around one-third.
To facilitate pricing, we used data to guide assumptions about the course of each hospitalization. In three recent case series in the U.S., the share of hospitalized COVID-19 patients who required a ventilator was 20 percent, 29 percent, and 33 percent, respectively. A small number of patients in these studies may have required a ventilator after the end of these studies’ follow-up period, so we adopt an estimate of 30% that is slightly above the average across the three studies. Given emerging clinical practice favoring early ventilation and early evidence of prolonged ventilation for COVID-19 from Washington State and Italy, we assumed that 90 percent of hospitalizations requiring a ventilator would exceed 96 hours of ventilation, which is a relevant threshold for pricing, as discussed below.
We then assigned hospitalization types to diagnosis related groups (DRGs), which are the basis for payment rates for hospital admissions in Medicare as well as some commercial plans. We assigned hospitalizations not requiring mechanical ventilation to DRGs 177-179 (respiratory infections and inflammations), consistent with the CMS guidance on classification of hospitalizations with a principal diagnosis of COVID-19.[4] Hospital stays with mechanical ventilation were placed in DRGs corresponding to stays with respiratory diagnoses and ventilation durations greater than 96 hours (DRG 207) or less than or equal 96 hours (DRG 208). COVID-19 patients who are admitted to the hospital with certain complications of COVID-19 may be placed in DRGs other than the five considered here, but we expect this group of patients to be relatively small, so we focus on these five core DRGs.
Utilization of Outpatient Services
Data on demand for COVID-19 outpatient services are sparser, so we made several simple assumptions about the use of these services. Specifically, we assumed that, for every person infected with SARS-Cov-2, there would be one office visit and one SARS-Cov-2 polymerase chain reaction (PCR) test performed. This assumption implicitly allows for the possibility that some people will be tested more than once (e.g., to confirm a result or to assess for clearance of the virus), while others (e.g., people with mild cases) will not qualify for testing or never seek testing. We also assumed that an additional 10 percent of individuals without COVID-19 would seek testing in an effort to rule out infection. To facilitate pricing, we assumed that office visits were split equally among level 3-5 established patient visits, as defined in Medicare payment rules.
We also assumed that COVID-19 would spur a number of emergency department (ED) visits equal to the number of hospitalizations in each age and coverage group. These ED visits are in addition to any ED visits that may precede hospitalizations; the cost of ED visits that result in hospitalization are implicitly included in our estimates of hospitalization costs.[5] To facilitate pricing, we assumed these visits would were split equally between levels 4 and 5 ED visits, also as defined by Medicare.
Unit Prices
We used different methods to assign unit prices to services for different payers:
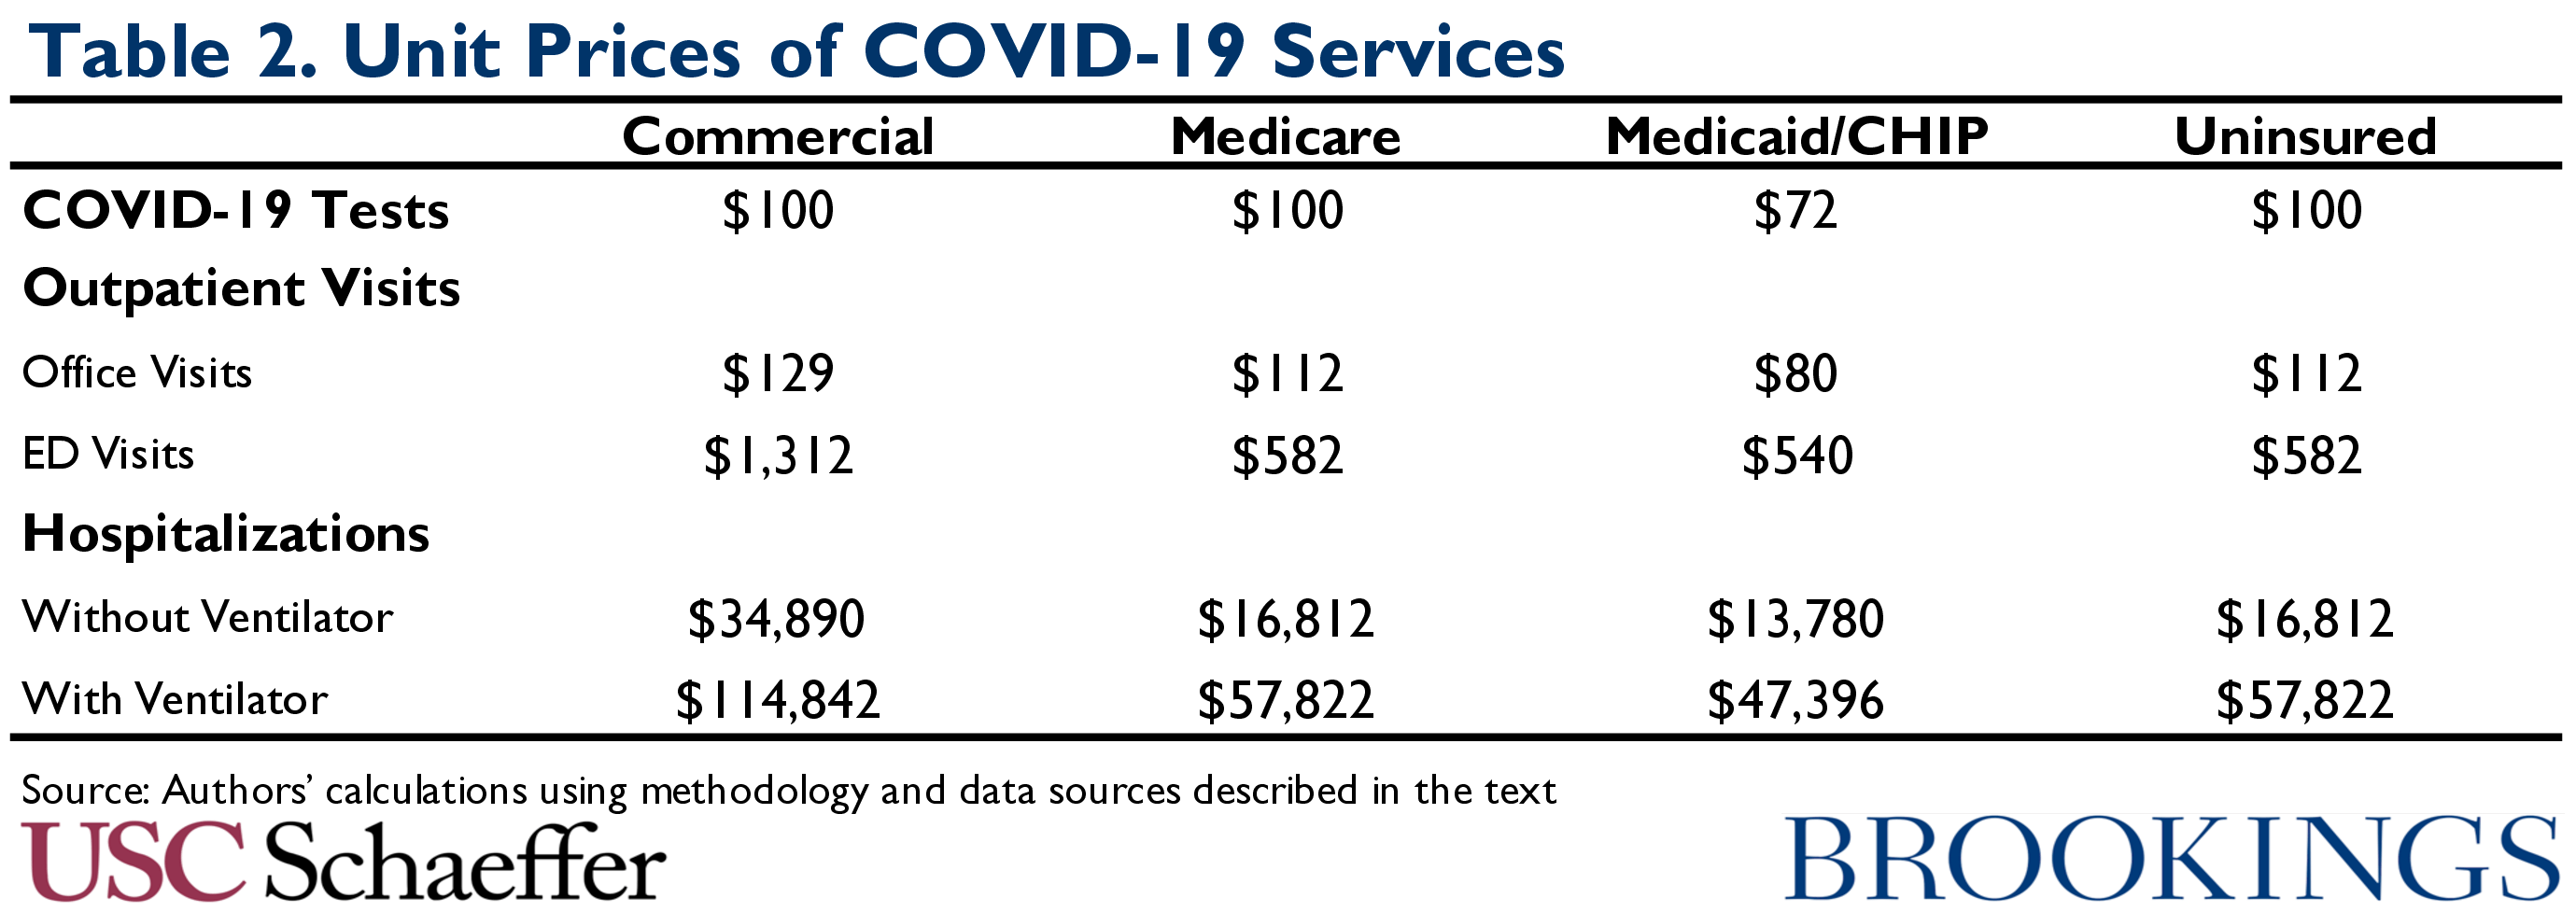
- Commercial coverage: Prices for office visits, ED visits, and hospitalizations were estimated by calculating average payments associated with the relevant DRGs or Current Procedural Terminology codes in the IBM/Truven Marketscan database.[6] Estimates for most services used 2016 data, while those for hospitalizations used 2018 data. Prices for ED visits and hospitalizations included both facility and professional payments. In all cases, estimates were trended forward to 2020 using the Congressional Budget Office’s January 2020 projections of the Consumer Price Index. Commercial plans were assumed to pay the same price for COVID-19 testing as Medicare, consistent with research finding that commercial prices for laboratory services are often similar to or could even be lower than Medicare prices.
- Medicare: We assumed that all services would be paid for at prices equal to those paid by traditional Medicare in light of evidence that the prices Medicare Advantage plans pay for hospital and physician services are generally very close to traditional Medicare’s. Prices for office visits and ED visits were calculated directly from the Medicare Physician Fee Schedule and Outpatient Prospective Payment System rules. The price of COVID-19 testing was assumed to be $100, consistent with the price CMS has announced for tests performed using “high throughput” technologies.
- Prices for hospitalizations were calculated using actual payments in Centers for Medicare and Medicaid Services Inpatient Utilization and Payment Public Use File for fiscal year 2017 in the relevant DRGs, adjusted for changes in the weights of those DRGs and the Inpatient Prospective Payment System base rate since fiscal year 2017, as well as the 20% increase in payments for COVID-19 admissions in the CARES Act.[7] We also made an upward adjustment to the prices of hospitalizations in each DRG to reflect physician services furnished during the hospitalization; this adjustment equaled approximately 16 percent of the pre-CARES-Act facility payment for each DRG and was based on estimates from Peterson and colleagues, adjusted to apply to our setting.[8]
- Medicaid/CHIP: Prices were generally based on Medicare prices. Payments to facilities were assumed to equal Medicare payment rates, excluding the 20 percent increase for COVID-19 admissions in the CARES Act, consistent with evidence that Medicaid payment rates for inpatient services are similar to Medicare rates on average. Payments for physician and laboratory services were assumed to be 72 percent of the Medicare amount, following Zuckerman, Skopec, and Epstein.
- Uninsured: Unit prices for COVID-19 tests, associated office visits, and facility services were assumed to be Medicare prices, consistent with the mechanisms set up to pay for those services for uninsured people under the FFCRA and the CARES Act, which require providers to accept the Medicare rate as payment in full. For simplicity, we make the same assumption for physician services associated with an ED visit or a hospital encounter, although we note that there is currently nothing to prevent physicians from billing patients their full professional charges in these instances. Our estimates should be interpreted with this in mind.
Table 2 summarizes our assumed unit prices for each type of service.
Methodological Limitations
Several important limitations of our analysis merit discussion.
First, we assume that the health care system has (or could add) enough capacity to meet all demand for COVID-19 care, but this is likely not the case, particularly with respect to testing services and, in the 60 percent infection scenario, hospital services. Our estimates may therefore overstate the actual amount of COVID-19 care that will be delivered and, correspondingly, total spending on that care. This possibility is at least partly captured in scenarios in which we examine lower hospitalization rates. On the other hand, our estimates of hospitalization rates in New York City may implicitly incorporate some effects of capacity constraints, and it is also possible that COVID-19 outbreaks in other areas will face less severe constraints, pushing hospitalization rates toward the high end of our range.
Second, we estimate facility payments for COVID-19 hospitalizations by commercial payers as the average payment for admissions falling in specified DRGs in the pre-COVID-19 world. For the substantial fraction of provider-insurer contracts based on DRGs, that is likely to closely approximate actual payments. However, some provider-insurer contracts determine payments as a percentage of charges or on a per diem basis. In these cases, our estimated prices could overstate or understate the prices of these hospitalizations if the resource intensity of COVID-19 admissions differs from the typical non-COVID-19 admission in the relevant DRGs. A similar issue likely affects physician spending associated with inpatient stays since longer or more intensive stays are likely to involve more physician services.
Third, we did not estimate payments for a vaccine or potential prescription drugs for COVID-19. Such treatments or vaccines would have direct costs, but could also reduce hospitalization costs. For example, preliminary data published by the National Institute of Allergy and Infectious Disease suggest that remdesivir may accelerate recovery for hospitalized COVID-19 patients. Broad use of such a drug could increase spending if the unit prices of COVID-19 hospitalizations rose to reflect the cost of administering the treatment (which would depend, in turn, on actions taken by state and federal policymakers and the details of providers’ contracts with insurers). On the other hand, if such a drug reduced how many hospitalized COVID-19 patients required any mechanical ventilation, long periods of mechanical ventilation, or long hospital stays in general, that would reduce the average price of a COVID-19 hospitalization, perhaps substantially. The net effect on total payments for COVID-19 care is uncertain.
Finally, we did not estimate spending on services that hospitalized COVID-19 patients may need after discharge (e.g., skilled nursing facility stays, home health visits, or follow-up physician office visits) or associated durable medical equipment (e.g., oxygen tanks or wheelchairs).
Estimated Payments for COVID-19 Care
Table 3 reports our spending estimates for six scenarios reflecting the two infection rates and three sets of hospitalization rates we consider; Appendix C presents tables with estimates by service type. We note that we report spending by primary type of coverage, which will not always align with who ultimately pays for that care. For example, in commercial insurance and Medicare, a portion of spending will generally be borne by enrollees in the form of cost-sharing, rather than by the payer. Similarly, cost-sharing incurred by Medicare beneficiaries who have supplemental coverage (Medigap, employer coverage, or Medicaid) will be borne by the supplemental insurer.
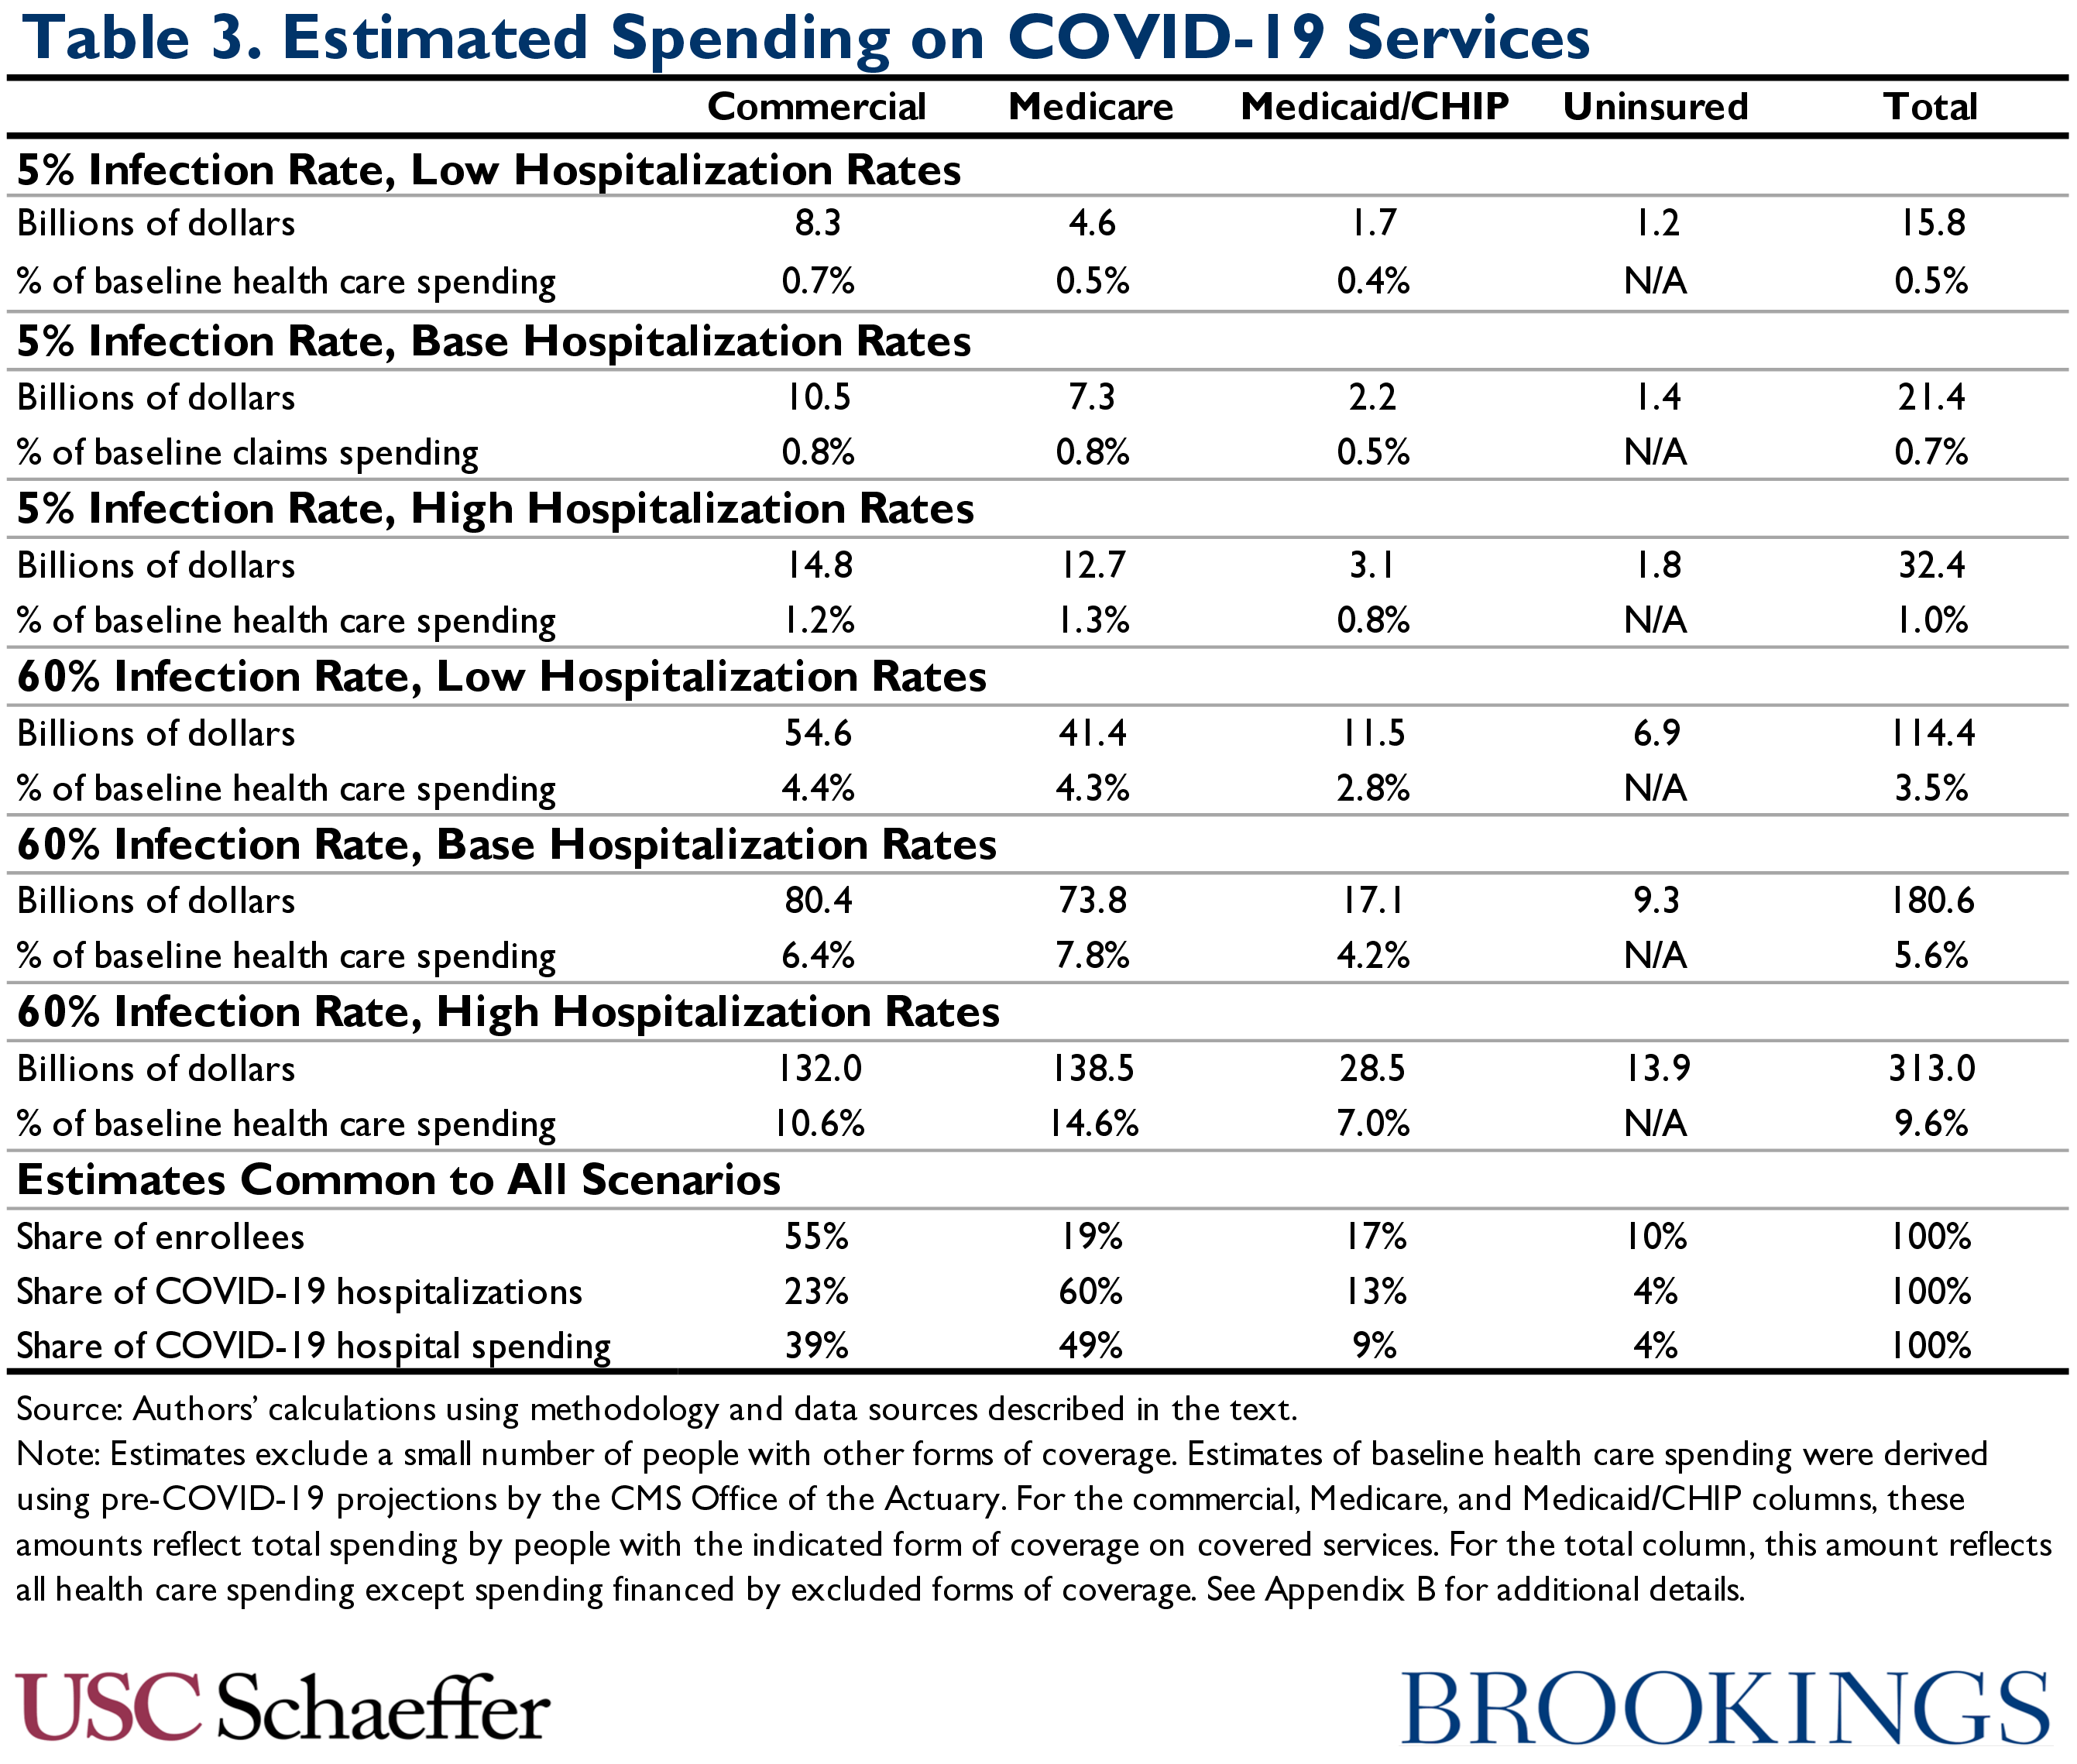
Three features of these estimates merit comment. First, as discussed earlier, total payments for COVID-19 care vary widely across the scenarios, ranging from as low as 0.5 percent of baseline health care spending ($16 billion) with a 5 percent infection rate and the lowest hospitalization rates we consider to as high as 9.6 percent of baseline health care spending ($313 billion) with a 60 percent infection rate and the highest hospitalization rates we consider. Naturally, as the table illustrates, uncertainty about hospitalization rates matters more when more people are infected.
Second, in all scenarios, public payers account for a disproportionate share of total spending. Despite accounting for only around one-third of the population, they account for between 40 percent of total spending (with a 5 percent infection rate and low hospitalization rates) and 53 percent of total spending (with a 60 percent of infection rate and high hospitalization rates). The public payer share rises with the hospitalization rate since those hospitalizations are expected to occur disproportionately among older and sicker populations, who are in turn disproportionately enrolled in Medicare and Medicaid. (It also rises modestly with the infection rate since the people not infected with SARS-Cov-2 who we assume would seek SARS-Cov-2 testing play a smaller role in total spending as the number of infections rises.)
Third, while Medicare and Medicaid/CHIP account for 72 percent of hospitalizations in all scenarios, they account for only 58 percent of hospital spending. This reflects the fact that public payers generally pay much lower prices for hospital care than private insurance plans.
Other Effects on Health Care Financing
While our estimates shed light on one important dimension of how COVID-19 will affect health care financing, we note that there are other effects that are not directly addressed by our estimates.
First, providers have postponed many non-COVID-19-related services. For example, the for-profit hospital chain Hospital Corporation of America recently told its shareholders that inpatient admissions (inclusive of COVID-19 admissions) in the first part of April were down 30 percent from the same period last year, emergency room visits were down 50 percent, and outpatient surgery volume was down 70 percent. Since those estimates include some COVID-19 services, the reduction in non-COVID-19 services must be even larger. Data from a firm that provides practice management software to physician practices shows similarly large reductions in ambulatory visits, with only a portion being replaced by telehealth visits.
Looking across all claims types, actuaries associated with a Society of Actuaries task force recently reported that plans had experienced a roughly 30 percent reduction in claims spending over the last month, citing conversations with “national and large regional carriers.” In recent days, publicly traded insurers Anthem, Humana, and Cigna have told their shareholders that they are seeing similar reductions.
In the likely scenario that some of that care is not rescheduled, payers will realize substantial savings that will at least in part offset their direct COVID-19 spending, while providers will lose substantial revenue. These savings to payers—and revenue losses for providers—could be smaller if delayed care results in more severe presentations of disease later or if providers sought to make up for income lost earlier in the year, such as by extending their hours of operation or being more aggressive in the quantity or intensity of services they recommended. But in light of the magnitude of the reported declines in non-COVID-19 spending and our estimates that direct COVID-19 spending will be moderate in size, it is quite plausible that COVID-19 will reduce payers’ 2020 claims spending on net. A recent analysis from Milliman concluded that this was indeed the most likely outcome.
Second, our estimates focus on insurer payments, not the costs of delivering care, so they do not directly address how COVID-19 will affect health care providers’ bottom lines. Normally, the prices paid by most major payers exceed the marginal cost of delivering care, so direct increases in volume caused by COVID-19 would be financially beneficial. However, the costs of treating COVID-19 patients may be higher than those of treating patients with other respiratory illnesses. For example, it may be costly to quickly ramp up capacity, COVID-19 patients may be more complex, and prices for personal protective equipment and supplies may be higher due to surging demand. The 20 percent increase in Medicare payment rates for COVID-19 hospitalizations enacted in the CARES Act may reduce this possibility, but this is an underexplored aspect of how COVID-19 is affecting providers’ finances.
Implications for Proposals to Provide Aid to Health Insurers
We close by considering what our results imply for recent insurance industry requests for federal aid to offset COVID-19 costs. The data lead us to two main conclusions.
First, there appears to be little rationale for providing aid to offset COVID-19 costs incurred during the 2020 plan year. Because premiums for the 2020 plan year have already been set, the only policy rationale for such aid would be to prevent insurers from becoming insolvent and being forced to exit the market, which would harm enrollees in the present and reduce competition down the road. But, as noted above, at least on average, COVID-19 may actually reduce insurers’ claims spending on net rather that increase it. Certainly, in light of the moderate size of direct COVID-19 spending in our estimates, the savings insurers will realized from reductions in non-COVID-19 care, and the fact that insurers’ premiums incorporate a profit margin, it appears quite unlikely that COVID-19 will threaten insurers’ solvency (barring some insurers’ members having idiosyncratically greater exposure to COVID-19 that goes well beyond the most adverse scenario we consider here). Thus, aid for the 2020 plan year would be entirely or at least primarily a windfall to insurers.[9]
Second, there may be a rationale for offering aid for the 2021 plan year, but only if appropriately structured. In particular, even if the current wave of COVID-19 infections is brought under control in the coming weeks, researchers and policymakers have suggested that one or more additional waves could follow later this year, and those waves could extend into 2021 or beyond. Renewed transmission would likely be accompanied by renewed reductions in non-COVID-19 care, so it is far from clear how a new wave of infections would affect insurers’ 2021 claims spending on net. But there is little question that insurers’ task of predicting 2021 claims spending is unusually hard. And insurers will face additional uncertainty related to how much care deferred during 2020 may be delivered in 2021 and how the COVID-19 treatment landscape may change by next year.
This greater-than-normal uncertainty about 2021 claims could lead insurers to demand a larger “risk premium” in 2021 premiums as compensation for bearing that risk. Policymakers may wish to avoid that outcome, due both to the costs that would impose on consumers and on the federal government to subsidize private insurance plans via the tax exclusion for employer-provided coverage, the premium tax credit for ACA Marketplace plans, and the Medicare Advantage program. Thus, there is rationale for implementing a temporary risk corridor program for private insurers that would relieve them of some of the costs they incur if claims spending turns out to be higher than expected, while offering the federal government some of the upside if claims spending is lower than expected.[10]
Other policy responses, like creating a reinsurance program that would relieve insurers of the cost of COVID-19 treatment, would be less well-tailored to this objective. A reinsurance program would pay out whether or not COVID-19 actually causes a net increase in insurers’ claims spending and, thus, do less to reduce insurers’ uncertainty about their claims spending than a risk corridor. And while payments insurers expected to receive from a reinsurance program would likely be passed through in premiums to some degree, if policymakers’ goal is to broadly reduce premiums for consumers—rather than address the uncertainties posed by COVID-19—there are more direct ways to achieve that goal, like expanding subsidies to consumers who purchase insurance coverage.
Appendix A: Deriving a Range of Possible COVID-19 Hospitalization Rates
The fundamental challenge when estimating COVID-19 hospitalization rates is estimating what fraction of the population has been infected with SARS-Cov-2. As described in the main text, our approach relies on data recently published by Sutton and colleagues from two hospitals in New York City that performed SARS-Cov-2 PCR testing on all women presenting for delivery from March 22 through April 4, 2020. The authors found that 15.4% of the women in this group tested positive for SARS-Cov-2.
We use this estimate to arrive at an estimate of the share of the New York City population ever infected with SARS-Cov-2 as of April 4. To facilitate doing so, we make three assumptions based on current data:
- Assumption 1: If a SARS-Cov-2 infection results in hospitalization, the hospitalization occurs 10 days after infection, reflecting a 5-day incubation period and a 5-day delay from the onset of symptoms to hospitalization, consistent with recent estimates of both time periods.
- Assumption 2: People infected with SARS-Cov-2 continue to generate positive SARS-Cov-2 PCR test results for 14 days following infection, consistent with the results of Wölfel and colleagues that the majority of infected patients tested positive for 9 days after symptom onset.
- Assumption 3: Infection rates among pregnant women presenting at the hospitals studied by Sutton and colleagues are representative of infection rates in the Bronx. This assumption is motivated by data showing that half of the labor and delivery volume of these hospitals is from the Bronx, with most of the remainder from adjacent neighborhoods in northern Manhattan.
Assumption 1 implies that the cumulative number of SARS-Cov-2 infections as of day t will be proportional to the number of people ever hospitalized for COVID-19 as of day t+10. Assumptions 1 and 2 together imply that the number of SARS-Cov-2 infections that are detectable via PCR testing on day t will be proportional to the difference between the number of people ever hospitalized as of day t+10 and the number of people ever hospitalized as of day t-4.
Under these assumptions, it is then possible to use data on COVID-19 hospitalizations reported by the New York City Department of Health and Mental Hygiene (NYCHealth) to estimate the ratio of cumulative SARS-Cov-2 infections in the Bronx as of April 4 to the average number of PCR-detectable SARS-Cov-2 infections in the Bronx from March 22 through April 4. This generates a ratio of 1.79.[11] Assumption 3 then implies that 27.6% (=1.79 x 15.4%) of Bronx residents had been infected by April 4.
Next, we adjust this estimate to reflect New York City as a whole by multiplying by the ratio of COVID-19 hospitalizations per capita in New York City as a whole to hospitalizations per capita in the Bronx as of April 14. This calculation involves an additional assumption that SARS-Cov-2 infected individuals are hospitalized at the same rate in New York City as a whole as in the Bronx. This results in a final estimated SARS-Cov-2 infection rate for New York City as a whole of 19.9 percent as of April 4.
To derive the age-specific hospitalization rates reported in Table 1, we assume a uniform infection rate across age groups and calculate the number of infected individuals in each of five age bands (0-17, 18-44, 45-64, 65-74, 75+) using the most recent Census population estimates for New York City. We then compare these infection counts to the number of hospitalizations by age group reported by NYCHealth for April 14, again under the assumption of a 10-day lag from infection to hospitalization. We derive the low and high hospitalization rates in Table 1 by multiplying the resulting estimates by 0.5 and 2.0.
These calculations are subject to several limitations. Most importantly, infection rates among pregnant women delivering at these two hospitals during this period may not be representative of infection rates in the broader population of the Bronx. Additionally, both the lag between infection and hospitalization and the duration of the period that infected individuals generate positive PCR test results vary across people, whereas we assumed that those periods were the same for all individuals. This analysis also does not adjust for any imperfections in the PCR test used to ascertain SARS-Cov-2 infection in the case series reported by Sutton and colleagues or any lags in hospitalization reporting by NYCHealth. Furthermore, due to variation in clinical decision-making and population characteristics, hospitalization rates could turn out to differ between New York City and the broader U.S. The presence of these various uncertainties is why this analysis considers a broad range of hospitalization rates.
We considered instead using results from a serology survey conducted by New York State to estimate cumulative infection rates. The state has reported three rounds of results—one on April 22, one on April 27, and one on May 1—which respectively showed that 21.2 percent, 24.7 percent, and 19.9 percent of New York City residents had antibodies for SARS-Cov-2. Unfortunately, it is unclear when the underlying tests were conducted and whether the successive sets of results are cumulative or reflect independent samples. Because of these and other uncertainties about the survey methods, we prefer to rely on the Sutton and colleagues estimates, for which we can better assess potential biases.
Nevertheless, the state’s serology estimates are quite consistent with our estimates. Consider, in particular, the results reported for April 22, for which there is the least ambiguity surrounding timing. If we assume that tests underlying the April 22 results were conducted 3 days prior, which is roughly consistent with the timeline the state has described, and antibodies emerge 12 days after infection, which is consistent with the findings of Wölfel and colleagues, then these estimates would reflect the cumulative SARS-Cov-2 infection rate in New York City as of April 7. If we again assume that there is a 10-day lag from infection to hospitalization, then this cumulative infection rate, together with cumulative hospitalization data from NYCHealth, imply an overall hospitalization rate of 1.9 percent, almost identical to the 1.8 percent hospitalization rate arrived at by our method.[12] Similar calculations using the later waves of the state’s survey would support similar conclusions.
Finally, we note that we considered instead relying on estimates of COVID-19 hospitalization rates from Verity and colleagues derived from Chinese data. When applied to a U.S. age distribution, the authors’ estimates imply a hospitalization rate of 5.5 percent, substantially above even our high hospitalization rate scenario. While the difference with our estimates may in part reflect differences in the approach used to correct for under-ascertainment of SARS-Cov-2 infections, it appears to also reflect differences in clinicians’ hospitalization decisions between the U.S. and China. Verity and colleagues do make an attempt to adjust their estimates to reflect the ways clinical practice in China may differ from that in other countries (specifically, the United Kingdom, the authors’ main focus), but this adjustment does not appear to match the U.S. experience, at least in New York City. (Of course, even within the U.S. meaningful differences likely exist across regions and hospitals in their clinical criteria for hospital admission, so it could, in principle, be correct for other portions of the U.S.)
Indeed, applied to the U.S. age distribution, the authors’ estimates imply there will be 5.7 COVID-19 hospitalizations for every one COVID-19 death. For comparison, as of April 30, New York City was reporting between 2.3 and 3.3 hospitalizations per death (depending on whether probable COVID-19 deaths are included alongside laboratory-confirmed deaths), and this ratio is likely to fall since inevitably some patients who are currently hospitalized will die. This pattern could arise if New York City hospitals were more resource-constrained or otherwise less able to provide life-saving care to COVID-19 patients than hospitals in China, but a much more likely explanation is that New York City hospitals are applying more stringent hospitalization criteria than are incorporated in Verity and colleagues’ estimates.
Appendix B: Calculation of Baseline Health Care Spending
We present many of our estimates as a percentage of baseline health care spending, meaning the health care spending projected for 2020 prior to the arrival of COVID-19. We construct our estimates of baseline health care spending using CMS’ March 2020 National Health Expenditure projections.
For the payer-specific percentages we report for commercial, Medicare, and Medicaid/CHIP coverage, our estimates of baseline health care spending encompass total spending by people with that type of (primary) coverage on services covered by that type of coverage, including beneficiary cost-sharing. We calculate this amount for each specific form of coverage as follows:
- Medicare: We begin with CMS’ projection of personal health care spending paid for by the Medicare program for 2020. This amount excludes cost-sharing incurred by Medicare enrollees, so we make an adjustment to include them. McArdle and colleagues estimate that traditional Medicare has an actuarial value of 80 percent, while a Milliman analysis suggests a typical actuarial value for Medicare Advantage plans of 89 percent. Under the assumption that 40 percent of Medicare enrollees are enrolled in Medicare Advantage plans in 2020, following the most recent Medicare Trustees Report, this leads to a scaling factor of 1.2 (=0.6/0.8 + 0.4/0.89). Applying this factor leads to a final estimate of baseline health care spending of $951 billion.
- Medicaid/CHIP: We begin with CMS’ projection of spending on personal health care by Medicaid for 2020. We then make two adjustments. First, we reduce this amount by 32 percent to remove spending by people who are enrolled in both Medicare and Medicaid, who are treated as being covered by Medicare in our analysis. Second, we add an estimate of CHIP spending, which we derive by starting with CMS’ estimate of actual aggregate CHIP spending for 2018 and trending that amount forward in accordance with CMS’ projections of growth in Medicaid spending from 2018 to 2020. The results in a final estimate of baseline health care spending of $409 billion.
- Commercial: We begin with CMS’ projection of spending on personal health care by private insurers 2020. We then make three adjustments. First, we remove spending by Medigap plans and employer plans that fills in Medicare cost-sharing. To do so, we calculate Medicare cost-sharing incurred by traditional Medicare enrollees using the approach discussed above in the context of Medicare and assume that 59 percent of that amount falls on private insurers, reflecting the share of traditional Medicare enrollees with supplemental coverage through Medigap or an employer in 2016.
- Second, we remove medical spending by property and casualty insurers. To do so, we use CMS’ estimate of the amount of such spending for 2018 and trending it forward to 2020 based on CMS’ projection of growth in overall private insurance spending.
- Finally, we add in an estimate of cost-sharing incurred by people with commercial enrollees. Specifically, we us data from the Health Care Cost Institute that show that employer-sponsored plans, which account for the large majority of private insurance enrollment, paid for 85% of enrollees’ total spending in 2018. This results in a final estimate of baseline health care spending of $1.251 trillion.
For total spending, we calculate baseline spending as total personal health care spending CMS projects for 2020, less an estimate of spending financed by TRICARE and Veterans Affairs coverage, which are the two main types of coverage that are excluded from our analysis. To construct that estimate, we start with the amount of health care spending that CMS reports was financed by these types of coverage in 2018 and trend that amount forward to 2020 based on CMS’ projection of growth in spending financed by “other health insurance programs,” the category in CMS’ projections that includes TRICARE and Veterans Affairs. This results in a final estimate of baseline health care spending of $3.246 trillion.
Appendix C: Estimates of COVID-19 Spending by Service Type
Table C1 reports our estimates of COVID-19 spending by service type in the 5 percent infection rate scenarios:
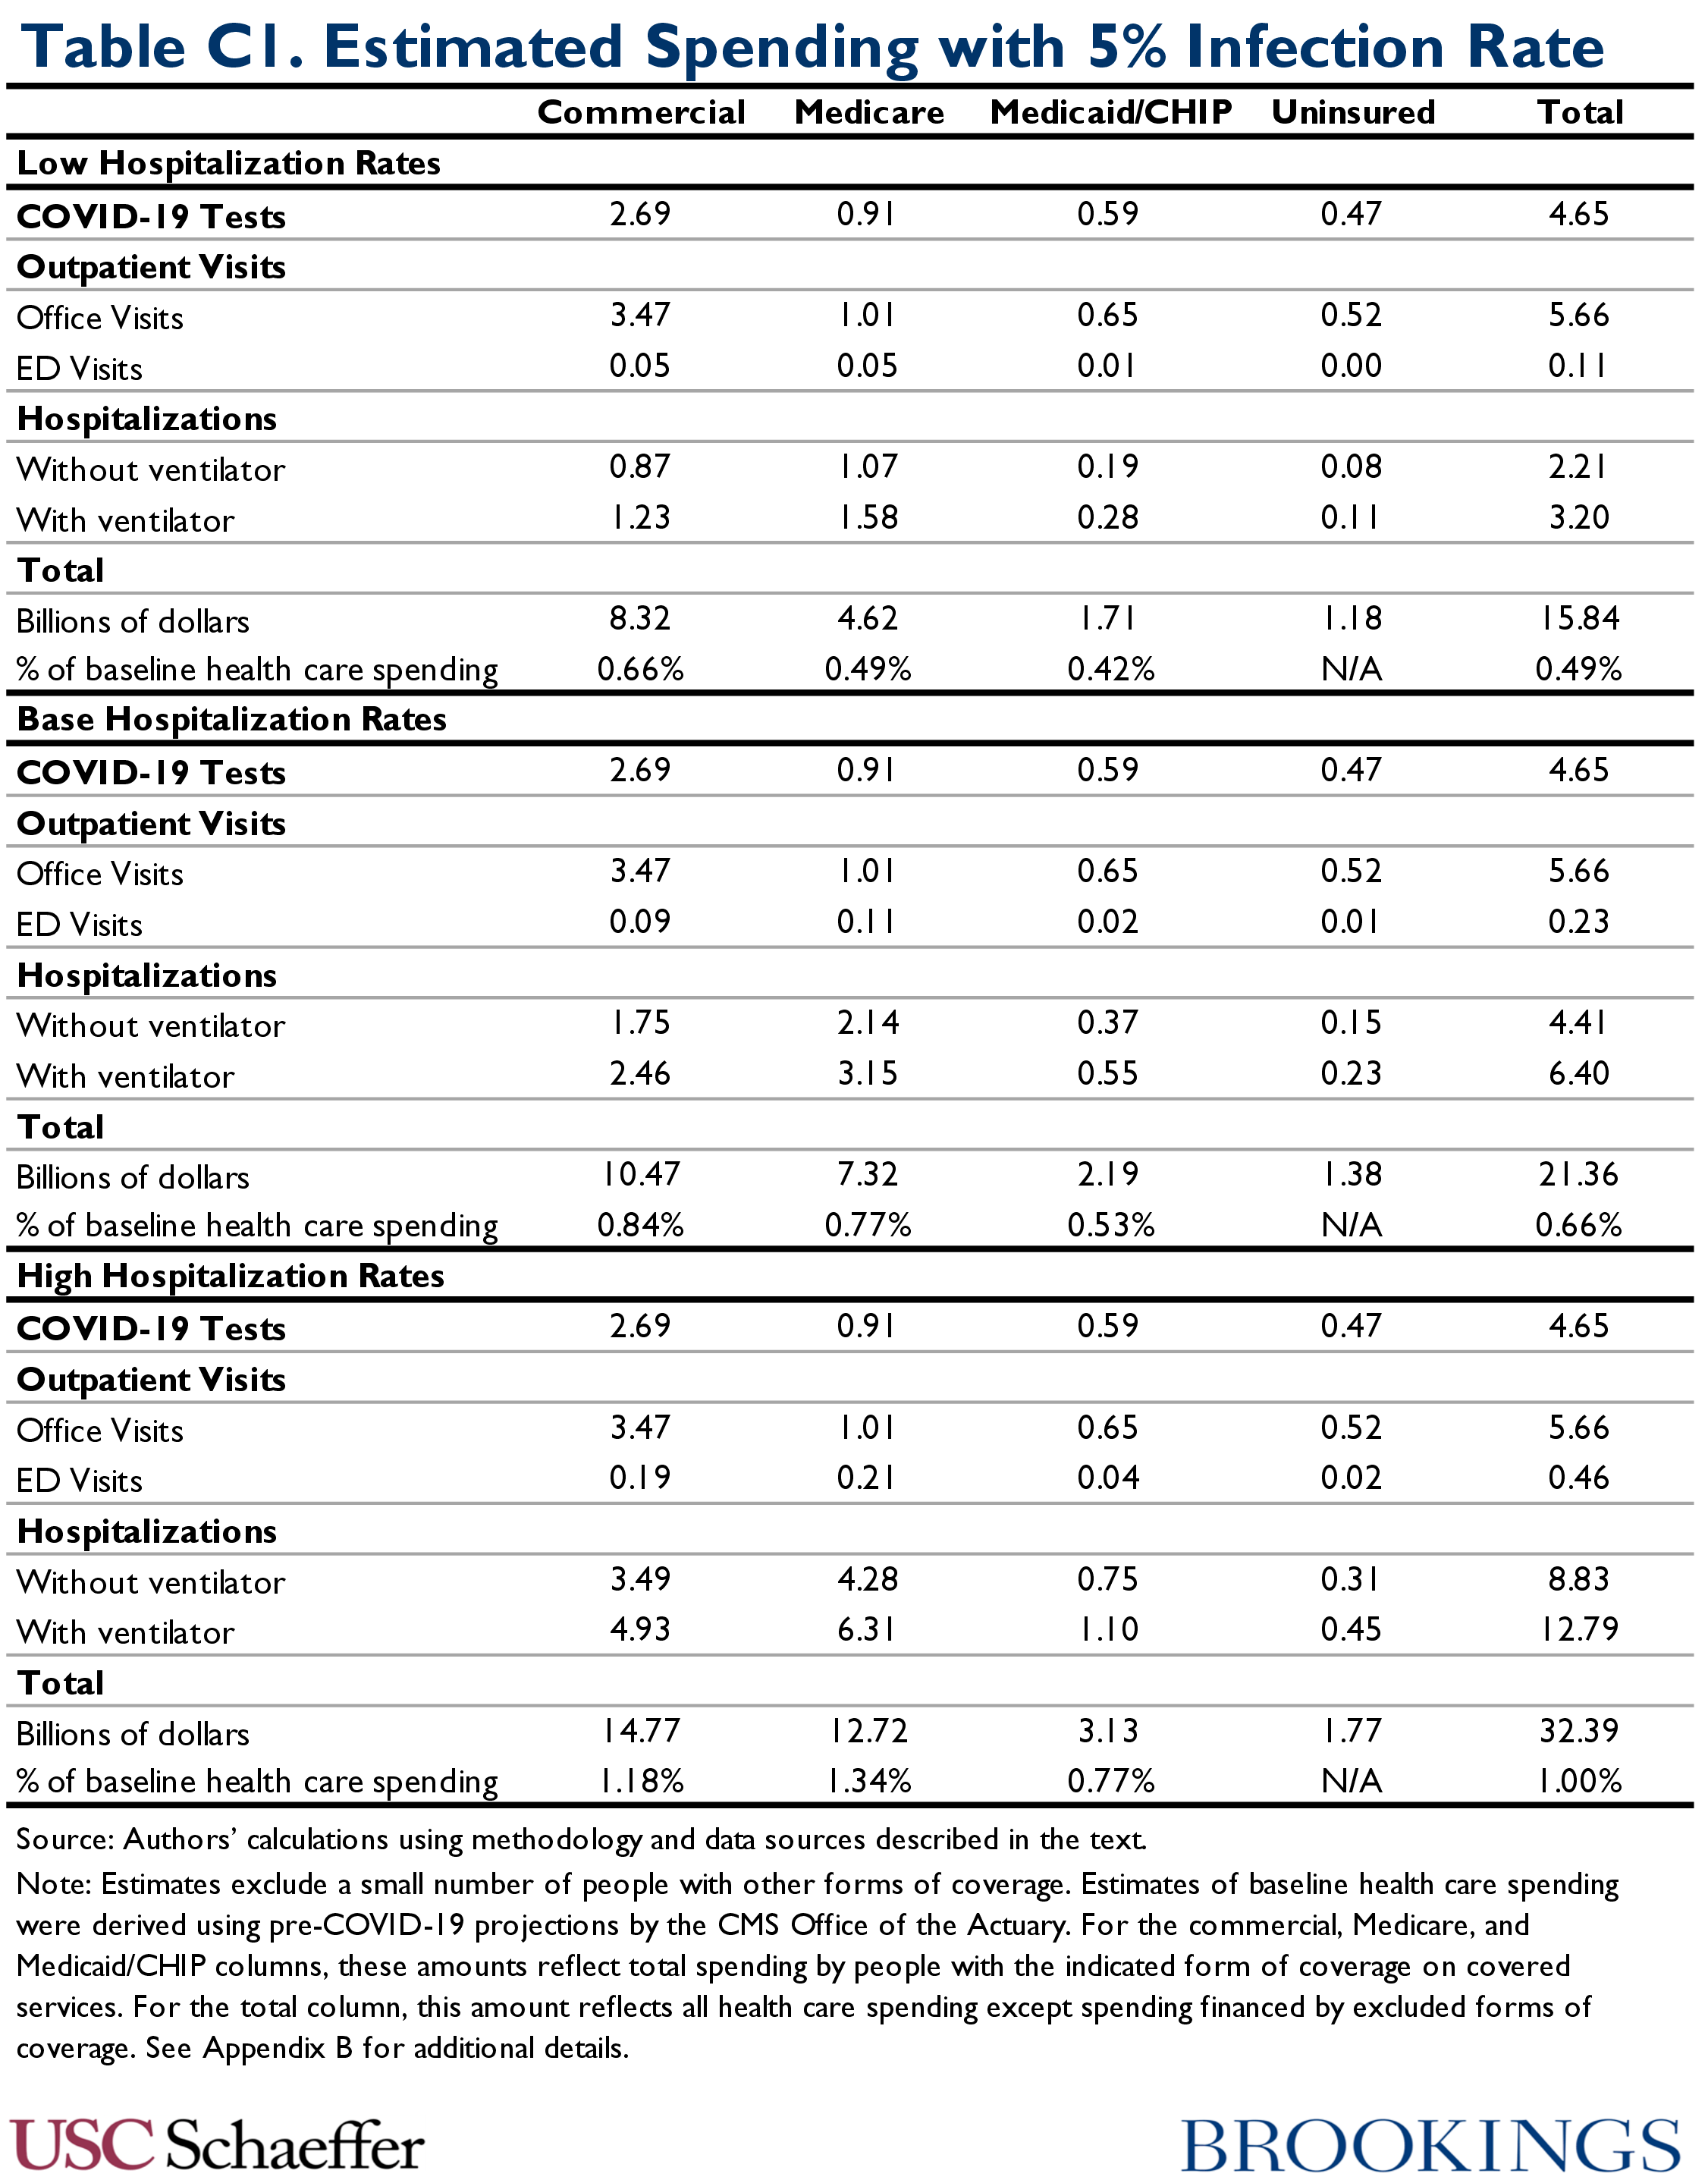
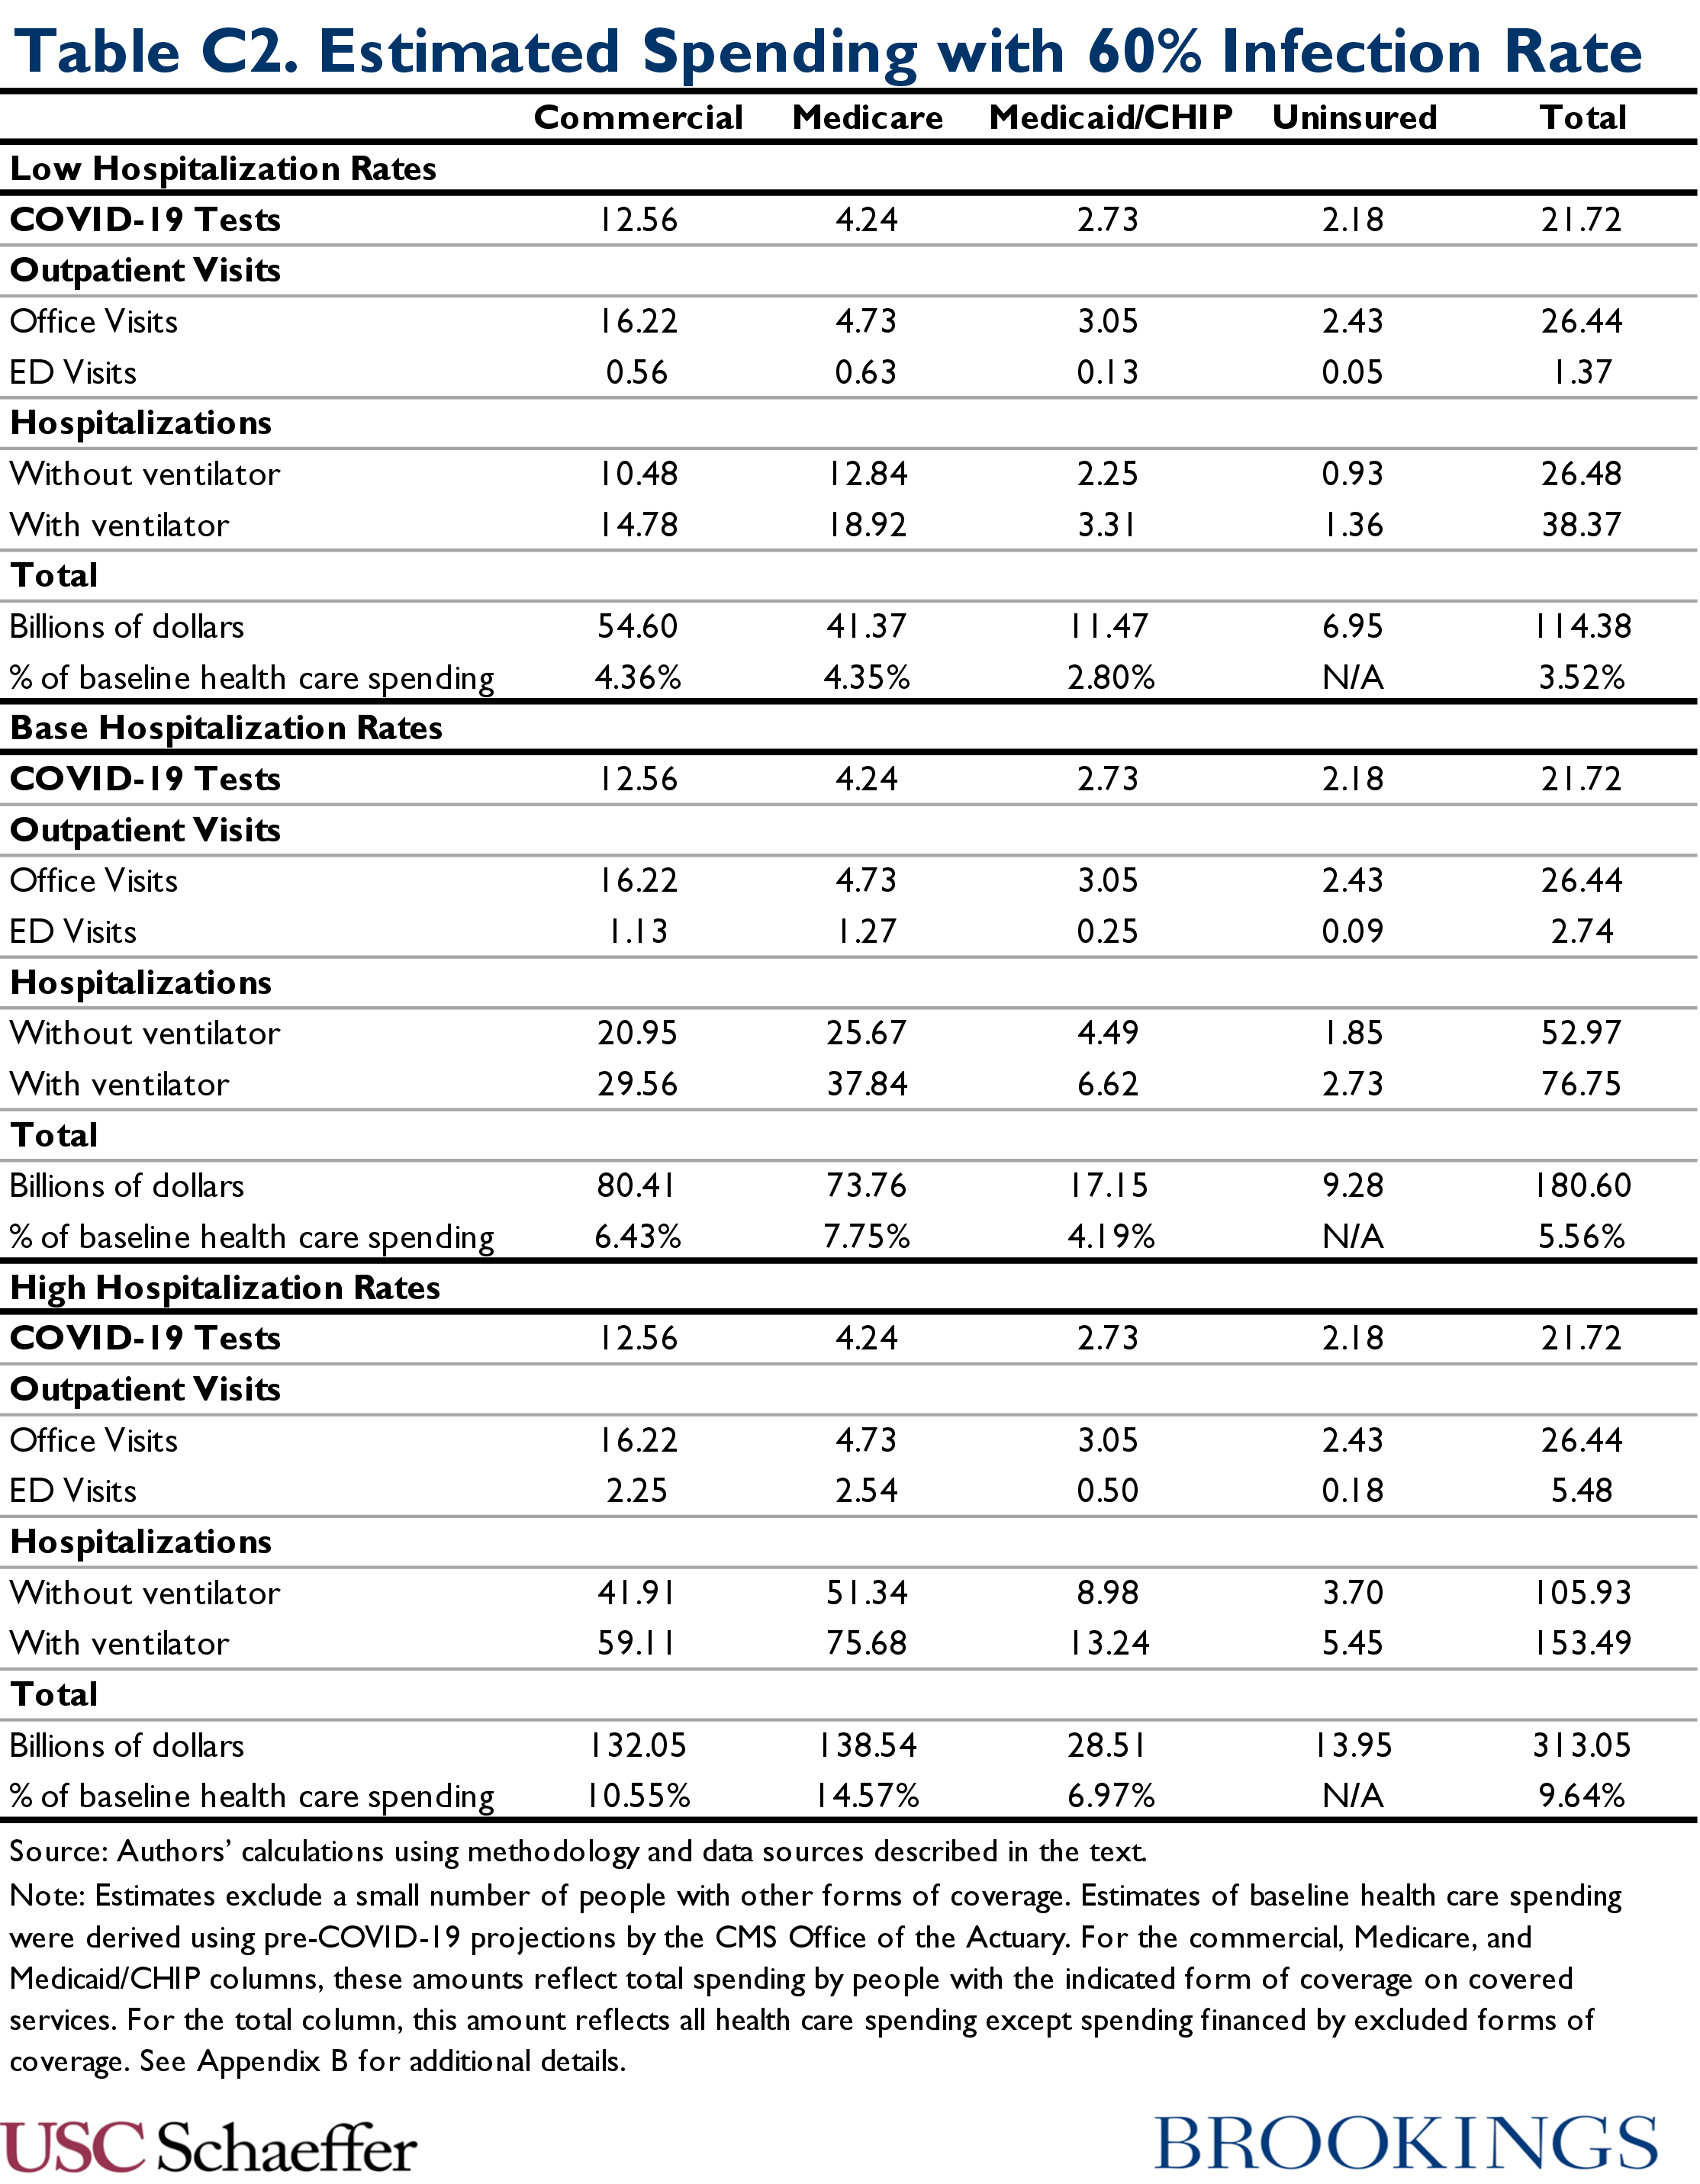
Table C2 reports our estimates of COVID-19 spending by service type in the 60 percent infection rate scenarios:
Zirui Song received a grant from the National Institutes of Health Office of the Director to complete work on this report, and is employed as a practicing physician in the Department of Medicine at Massachusetts General Hospital and as a faculty member in the Department of Health Care Policy at Harvard Medical School. No outside party has the right to review this work prior to publication at Brookings.
Kathleen Hannick created the graphics for this report.
FOOTNOTES
- People reporting multiple types of coverage were assigned a single type according to the following hierarchy: Medicare, Medicaid/CHIP, commercial, and other coverage. We scaled these estimates to reflect a U.S. population of 333 million, consistent with the Census Bureau’s most recent population projections. We estimated that 54 percent had commercial insurance, 19 percent had Medicare, 17 percent had Medicaid, and 9 percent were uninsured. We do not report estimates for the 2 percent of the population with other types of coverage. We estimated coverage separately for five age groups: 0-17, 18-44, 45-64, 65-74, and 75 and older to align with the hospitalization rate data described below.
- This assumes that SARS-Cov-2 infection does in fact confer long-term immunity, which is not guaranteed.
- Specifically, we calculated the average number of hospitalizations in the last 12 months by age and coverage type, excluding hospitalizations by people who reported being pregnant in the last 12 months. The NHIS does not ask about pregnancy for people under age 18, so we tallied all hospitalizations for these age groups.
- These rules became effective on April 1. Prior to that date, many COVID-19 hospitalizations not involving mechanical ventilation were likely placed in DRGs 193-195 (pneumonia), consistent with the classification of the ICD-10-CM diagnosis code previously in use for COVID-19. Since the overwhelmingly majority of COVID-19 hospitalizations will occur on or after April 1, we use the current DRGs in our estimates.
- Our method of estimating the prices of hospitalizations may not fully capture the cost of physician services delivered in the ED prior to hospital admission, but this should have only a small effect on our estimated prices.
- We calculate a single pooled price for hospitalizations in DRGs 177-179 that reflects the relative numbers of admissions in the three individual DRGs in the Marketscan data since we have no strong basis for assessing how the relative mixture of these three DRGs might change in the context of COVID-19.
- Again, we calculate a single pooled price for hospitalizations in DRGs 177-179 that reflects the relative number of admissions in the three individual DRGs in the CMS data.
- Specifically, Peterson and colleagues report that physician services payments are 11.7 percent of facility payments on average across the three pneumonia DRGs (the best match for the DRGs we consider here among the DRGs studied by Peterson and colleagues) in a sample of commercial claims. This ratio is likely somewhat higher in Medicare because physician services prices are higher relative to facility services prices in Medicare. We adjust for this difference using estimates that commercial plans pay inpatient prices 1.89 times Medicare’s and pay physician services prices 1.35 times Medicare, yielding a final adjustment of 16.4% (=11.7% x 1.89/1.35).
- In principle, insurers could be required to pass a portion of this windfall through to consumers due to medical loss ratio (MLR) requirements. However, the extent to which MLR requirements would bind in this instance is quite uncertain, particularly because the MLR program determines whether insurers are required to pay rebates based on performance over a three-year period, which would tend to reduce the likelihood that 2020-specific developments result in insurers paying out rebates.
- 10Shifting risk onto the government’s balance sheet only makes sense if the public sector can bear that risk at lower cost than private insurers. If insurance and capital markets were perfectly efficient, that would likely not be the case. In practice, however, insurers appear to demand risk premia even in cases where the economic costs of bearing risk should be very low, suggesting that shifting risk onto the public sector could be appropriate; Layton, McGuire, and Sinaiko provide a helpful review of the literature on this point.
- There is a discontinuity in the number of hospitalizations reported by NYCHealth between April 6 and April 7 that reflects, at least in part, the addition of some hospitalizations that occurred before April 7 but had not previously been reported. We make a proportional upward adjustment to reported hospitalizations for dates prior to April 7 to eliminate this discontinuity based on the assumption that the growth rate of hospitalizations from April 6 to April 7 would otherwise have matched that from April 7 to April 8.
- This 1.8 percent estimate differs slightly from the 1.9% weighted average hospitalization rate estimate reported in Table 1 due to slight differences between the New York City and national age distributions.
You must be logged in to post a comment.