In the United States, most people obtain health insurance either through an employer or a public program like Medicare or Medicaid. But some people—about 11% of the non-elderly population in 2019 according to this paper’s estimates—lack access to public or employer coverage. These people must instead seek nongroup coverage, either through the Marketplaces established by the Affordable Care Act (ACA) or outside the Marketplaces. For many purposes, including assessing proposals to increase nongroup enrollment such as the recently enacted increases in the ACA’s subsidies for Marketplace plans, it is useful to know how many people have nongroup coverage, what forms of nongroup coverage they have, how many potential enrollees remain unenrolled, and how enrollment rates vary by income.
To that end, this paper estimates how many non-elderly people in different income groups held Marketplace coverage, off-Marketplace coverage that qualifies as minimum essential coverage (MEC) under the ACA, or non-MEC nongroup policies (e.g., short-term limited duration plans), as well as how many lacked any coverage, in 2019. I focus on enrollment among people who: (1) are ineligible for public or employer coverage; (2) are legally present in the United States; and (3) do not fall in the Medicaid “coverage gap.” This group, which I refer to as the population of “potential subsidy recipients,” is the group most likely to be targeted by efforts to increase nongroup enrollment such as the recently enacted subsidy expansions. Thus, estimates for this population are particularly policy relevant.
Estimating patterns of nongroup enrollment is challenging. Household surveys do a poor job of measuring nongroup coverage since respondents often report other forms of coverage as nongroup coverage and vice versa, while administrative data lack needed detail. Thus, this paper produces estimates by blending administrative and survey data. In brief, I start with tabulations of insurance coverage by income in 2016 produced using tax data by Lurie and Pearce, which likely offer the best available snapshot of nongroup enrollment by income. I then use a combination of survey, administrative, and other data to construct crude estimates of enrollment in non-MEC nongroup policies (which are not captured in the tax data), trend the various estimates forward to 2019, and make other needed adjustments. In doing so, I pay careful attention to the limitations of the survey data sources and mitigate those limitations to the greatest extent possible.
Findings Regarding Patterns of Nongroup Enrollment in 2019
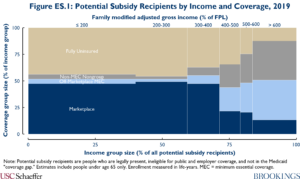
Figure ES.1 summarizes this paper’s estimates of nongroup enrollment and uninsurance among non-elderly potential subsidy recipients in 2019. The paper highlights four principal findings, each of which has important implications for policymakers, researchers, or both.
Finding #1: Only half of potential subsidy recipients were enrolled in nongroup MEC, and take-up rates varied only modestly with income. Slightly more than half (52%) of those with incomes below 400% of the federal poverty level (FPL), the income limit for the ACA’s Marketplace subsidies as of 2019, were enrolled in nongroup policies that constitute MEC. This fraction was slightly lower (49%) among people with incomes above 400% of the FPL. These estimates indicate that there was considerable scope to increase enrollment in nongroup MEC at all income levels, including at income levels where Marketplace subsidies were already available as of 2019. This implies that the recently enacted American Rescue Plan Act, which both made subsidies more generous for people already eligible and extended them above 400% of the FPL, has the potential to increase MEC enrollment across the income distribution.

Finding #2: The large majority of potential subsidy recipients who lacked MEC had incomes below 400% of the FPL. Among potential subsidy recipients who lacked nongroup MEC, 70% had incomes below 400% of the FPL. Thus, not only is there scope to increase enrollment in nongroup MEC among people who were already eligible for subsidies, most of the opportunity to increase overall take-up is in this group.
Finding #3: At lower income levels, potential subsidy recipients who lacked MEC were typically uninsured, while at higher incomes many held non-MEC nongroup policies. Among potential subsidy recipients without nongroup MEC who had incomes below 400% of FPL, 91% were fully uninsured, while the remaining 9% held non-MEC nongroup policies. By contrast, at higher income levels, 61% held non-MEC nongroup policies and only 39% were fully uninsured. This suggests that efforts to increase MEC enrollment may do less to improve financial protection at higher income levels, although those improvements may still be substantial since non-MEC policies often offer much less robust coverage. It also suggests that efforts to restrict the availability of non-MEC policies would have their largest effects at higher income levels.
Finding #4: Lower-income potential subsidy recipients with MEC overwhelmingly held Marketplace coverage, while higher-income people generally held off-Marketplace MEC. Among potential subsidy recipients with nongroup MEC, 91% of those with incomes below 400% of the FPL held Marketplace coverage, whereas just 35% did above 400% of the FPL. One implication is that research that focuses only on Marketplace enrollees can paint a very misleading picture of nongroup enrollment as a whole.
Since subsidies were available below 400% of the FPL, it is notable than anyone at these income levels opted for off-Marketplace plans. This could indicate that awareness of subsidized coverage is incomplete, as some surveys suggest. Additionally, underwritten off-Marketplace policies (grandfathered and transitional MEC policies and non-MEC policies) may sometimes be less expensive than subsidized Marketplace coverage for healthier moderate-income enrollees.

Findings Regarding Trends in Nongroup Enrollment from 2016 to 2019
The method this paper uses to estimate enrollment in 2019 also generates estimates of how different categories of enrollment changed from 2016 to 2019. The paper highlights two main findings.
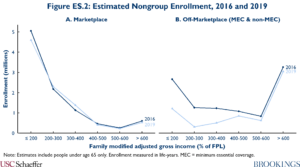
Finding #5: Off-Marketplace enrollment fell sharply over this period, particularly at lower income levels, while Marketplace enrollment was steady. Figure ES.2 depicts these trends graphically. The decline in off-Marketplace enrollment is unsurprising since premiums of ACA-compliant policies rose sharply over this period and since some healthier people with underwritten “grandfathered” or “transitional” policies churned out of the market over time and likely were not replaced. However, to the extent this decline was driven by rising premiums, it is somewhat surprising that there was no offsetting increase in Marketplace enrollment at incomes below 400% of the FPL, where subsidies were available. This could indicate that people exiting off-Marketplace plans were unaware that subsidized Marketplace coverage existed. Alternatively, it could indicate that Marketplace enrollment was stable in the aggregate because an influx of former off-Marketplace enrollees was offset by other factors that reduced Marketplace enrollment, such as the elimination of the individual mandate penalty.
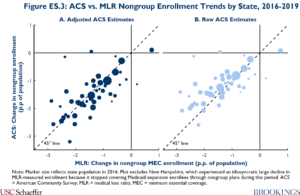
Finding #6: Enrollment in non-MEC nongroup policies may have been steady from 2016 to 2019. Existing data sources do not directly measure trends in non-MEC nongroup enrollment. To fill this gap, this paper constructs an indirect measure of those trends by combining data from insurer Medical Loss Ratio (MLR) filings with data from the American Community Survey (ACS). Because the MLR data only capture enrollment in nongroup MEC, while the ACS plausibly captures all nongroup enrollment, any difference in the enrollment trends shown in the MLR and ACS data may reflect changes in non-MEC enrollment.
Figure ES.3 shows that estimates of the change in nongroup enrollment from 2016 to 2019 derived from the MLR and ACS data are very highly correlated at the state level. Furthermore, after using the results of Pascale, Fertig, and Call to adjust for known patterns of coverage misreporting in the ACS, the ACS and MLR data show very similar enrollment trends, on average across states. This finding suggests that enrollment in non-MEC nongroup policies may have changed little over this period.

Stable enrollment in non-MEC policies may be the net effect of offsetting factors. On the one hand, premium increases for ACA-compliant plans, elimination of the individual mandate policy, and federal regulatory changes favoring short-term limited duration plans may have increased non-MEC enrollment. However, many states implemented new restrictions on short-term plans during this period, which may have worked in the opposite direction.
Opportunities to Improve Nongroup Enrollment Data
The paper closes by making two recommendations for how data on enrollment in nongroup coverage could be improved in the future. First, the Treasury Department should routinely publish tabulations of insurance coverage by income group based on tax data like those produced by Lurie and Pearce and consider publishing estimates that are further disaggregated by state of residence.
Second, policymakers should collect better data on enrollment in non-MEC nongroup policies. The best approach would be to extend the tax reporting regime that applies to MEC policies to non-MEC policies. Encompassing all types of non-MEC nongroup policies would likely require legislation, but it might be possible to do so for short-term limited duration policies via administrative action. If extending the tax reporting regime is not feasible, it would be valuable to at least collect aggregate information on non-MEC nongroup enrollment. The National Association of Insurance Commissioners has collected some data on enrollment in short-term limited duration policies and may collect more, but these efforts should be extended to other types of non-MEC nongroup policies. Additionally, these data should be made broadly available to researchers and policymakers, which is not currently planned.
Acknowledgements:
I thank Loren Adler, Paul Ginsburg, and Jason Levitis for helpful comments and conversations. I thank Conrad Milhaupt for excellent research assistance, and Brieanna Nicker for excellent editorial assistance. All errors are my own.

You must be logged in to post a comment.