In the charts below, we explore the impact of social vulnerability and vaccine hesitancy using data made available by the Centers for Disease Control and Prevention (CDC) and the Department of Health and Human Services.
Last updated: June 5, 2022
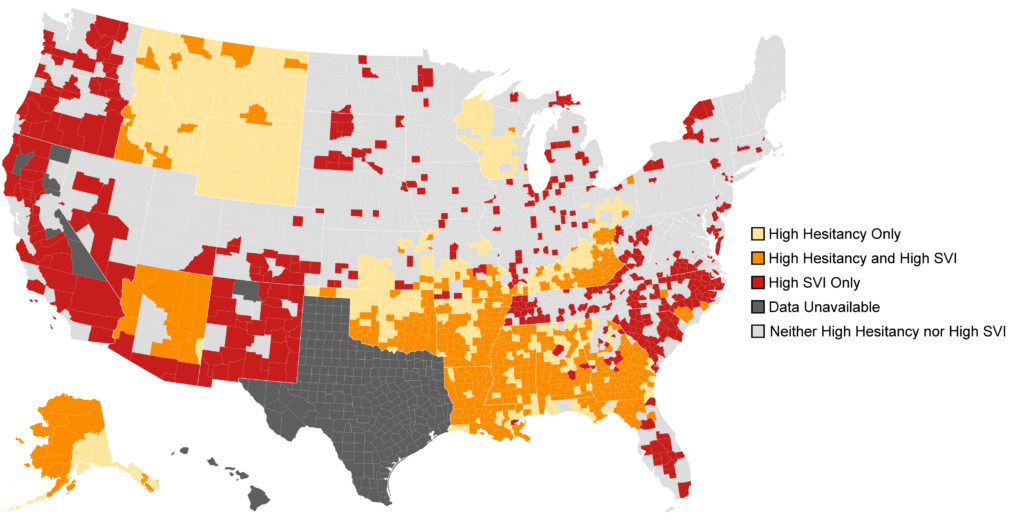
We define hesitancy as the percentage of residents who said that they would “probably not” or “definitely not” receive a COVID-19 vaccine at this point in time. Counties were divided into tertiles of low, moderate and high hesitancy, with equal numbers in each category.
The CDC’s Social Vulnerability Index (SVI) was used to compare vulnerability between counties. Again, counties were divided into tertiles of low, moderate and high social vulnerability.
U.S. County-Level COVID-19 Vaccination Coverage, by Social Vulnerability Index (SVI) and COVID-19 Vaccine Hesitancy Levels
| Low SVI | Moderate SVI | High SVI | |
|---|---|---|---|
| Low hesitancy | 80.5% | 81.6% | 76.2% |
| Moderate hesitancy | 69.7% | 70.2% | 71.6% |
| High hesitancy | 65.0% | 62.5% | 58.3% |
Analysis in: Crane, M., Faden, R., Romley, J.. (2021) Health Affairs. November 2021.
Data is updated weekly based on the prior Sunday's data. Data last updated 6/5/2022.
A press release about the study is available here. The full study is available in the November issue of Health Affairs.
You must be logged in to post a comment.