
Editor’s Note: This analysis is part of the USC-Brookings Schaeffer Initiative for Health Policy, which is a partnership between Economic Studies at Brookings and the University of Southern California Schaeffer Center for Health Policy & Economics. The Initiative aims to inform the national health care debate with rigorous, evidence-based analysis leading to practical recommendations using the collaborative strengths of USC and Brookings.
Provider charges represent a list price for their services and are typically unilaterally set by the provider. For most people, most of the time, a provider’s list price is irrelevant – what typically matters is the negotiated price between your insurance plan and the provider and the cost-sharing that’s required of you – but provider charges matter greatly in two main circumstances. First, uninsured patients are often liable for a provider’s full charge, although some state laws attempt to limit this liability and many times uninsured patients are able to obtain discounts. Second, when a patient is treated by a provider outside of their insurer’s network, he or she can be billed at the provider’s charge amount – or list price. In this situation, the insurance company usually pays only a portion of the bill (often roughly in line with what they would have paid an in-network provider), potentially leaving the patient to make up the difference between the provider’s list price and what their insurance paid – a practice known as “balance billing.” The size of balance bills, then, depends on the magnitude of a provider’s charge.
For out-of-network providers that patients proactively choose, charges face some market constraint because the provider may wish to attract out-of-network patients, for whom cost is a factor. But for certain services, patients are unable to choose their provider, and therefore can unknowingly receive care from an out-of-network provider, potentially resulting in a large, unsuspected bill – what has been termed a surprise out-of-network bill. Most commonly, this can occur during an emergency (where some combination of the ambulance, hospital, or clinicians may be out-of-network) or when treated by ancillary or similar providers (such as anesthesiologists, radiologists, and pathologists) at an in-network facility during elective care. Providers that patients do not proactively choose, therefore, have an ability to treat a significant number of unsuspecting patients on an out-of-network basis. Because charges are unilaterally set and patients typically have no choice over the specific provider who treats them regardless of cost, charges for emergency and ancillary clinicians are subject to minimal market constraint.
This analysis examines data on charges for providers treating Medicare patients released by the Centers for Medicare & Medicaid Services (CMS) from 2012-17, similar to previous analyses focused on these charges in 2014 and 2016. While the charges reported to Medicare do not affect Medicare payment, we believe these generally represent providers’ charges across payers.
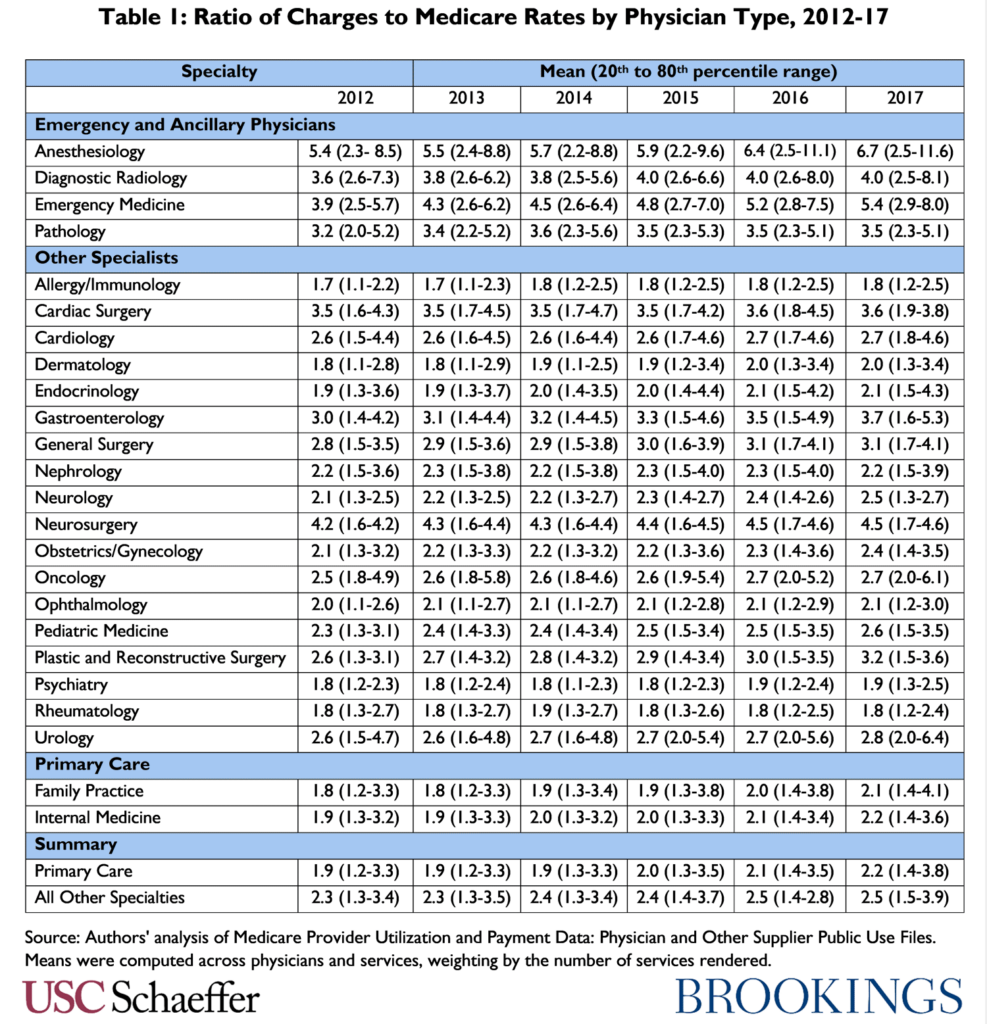
Consistent with previous analyses, we find that specialties possessing the ability to surprise bill out-of-network patients – emergency and ancillary physicians – have charged notably higher amounts relative to Medicare rates than other specialties, both on average and among the highest chargers in a specialty.
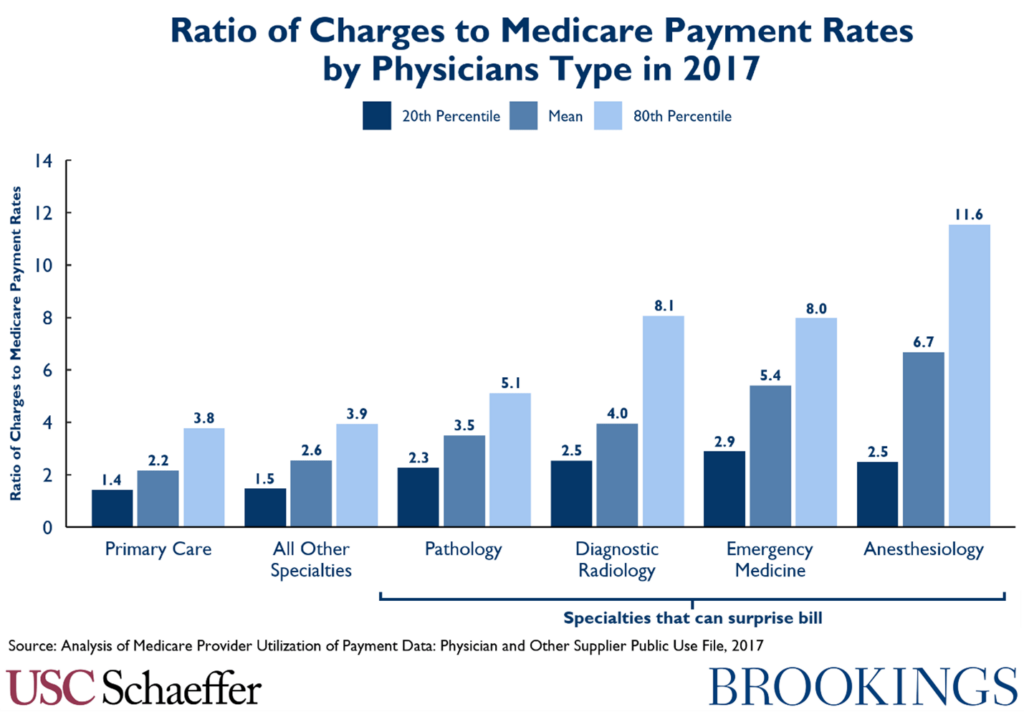
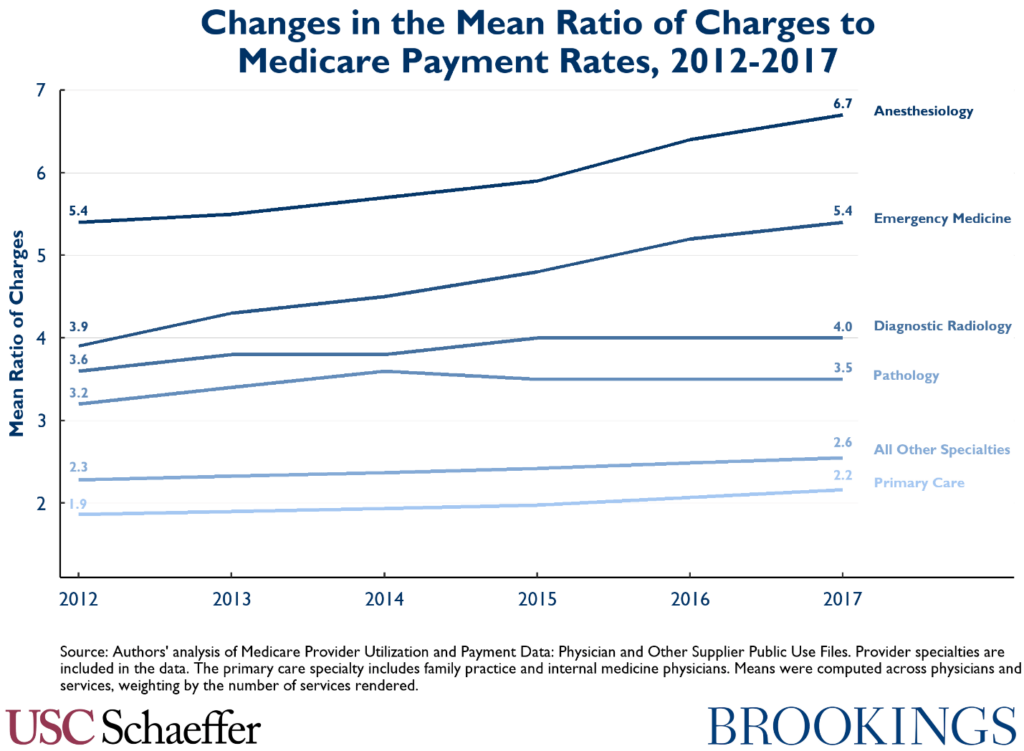
In addition to being higher, average charges have been growing especially fast relative to Medicare payment rates in the two specialties most commonly associated with surprise billing – emergency medicine and anesthesiology – at 6.7 and 4.4 percent annually on average from 2012-2017, respectively. Interestingly, though, while still at high levels relative to other specialties, radiology and pathology charges relative to Medicare rates have grown roughly in line with other specialties since 2012.
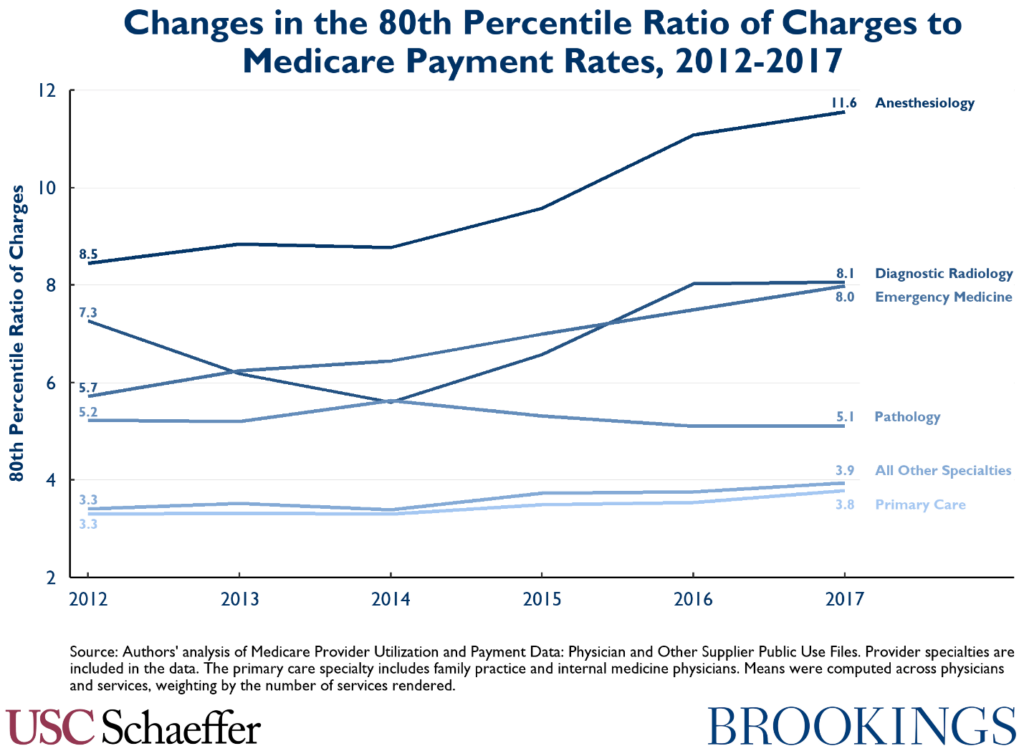
Growth in the 80th percentile of charges relative to Medicare rates by specialty has been even more pronounced for emergency medicine and anesthesiology, with roughly 40 percent growth over the five-year period.
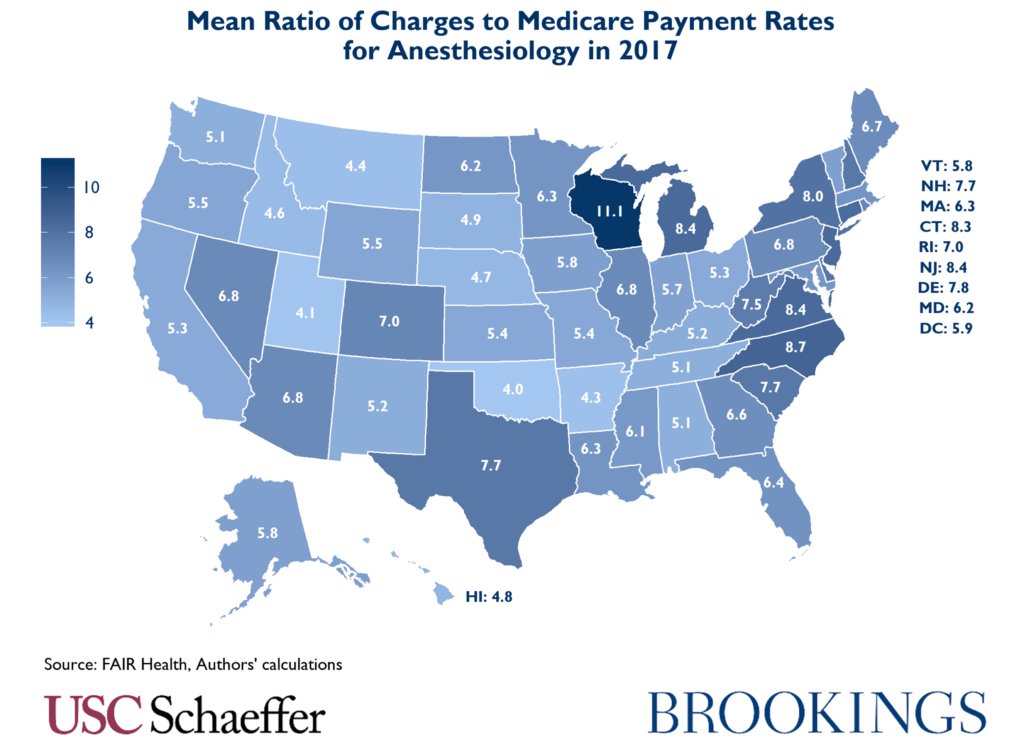
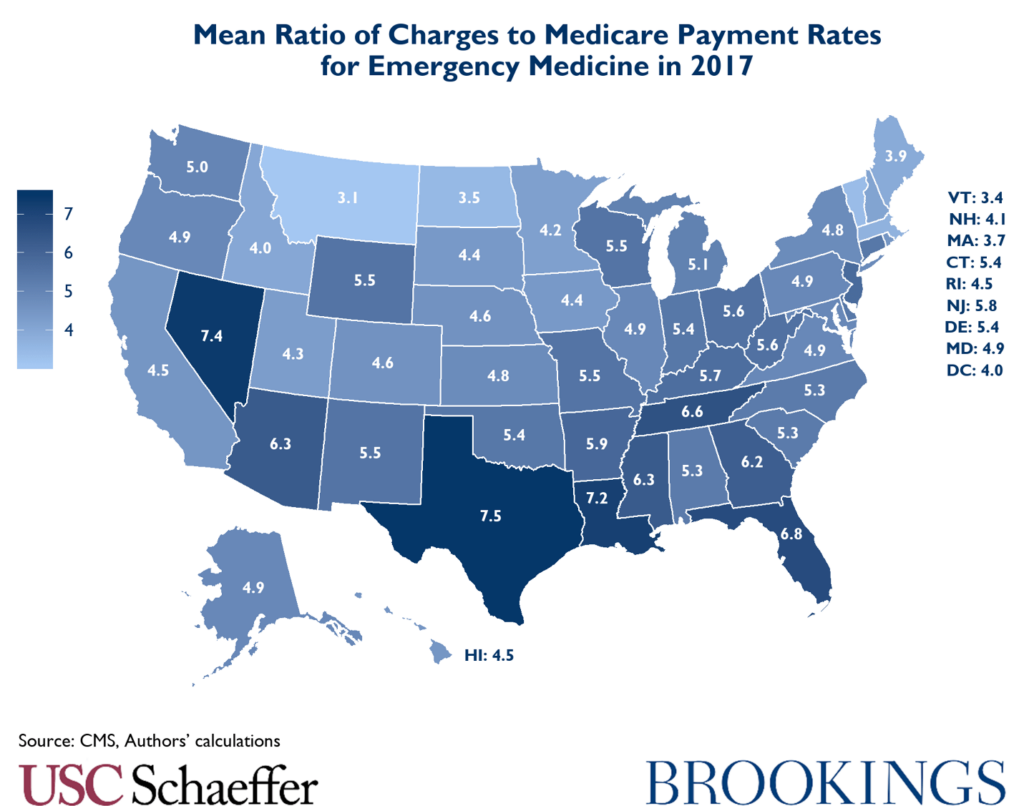
The ratio of mean charges to Medicare payment rates for these specialties also varied significantly state to state in 2017. For example, mean anesthesiology charges around the country varied from four times Medicare rates for the same services in Oklahoma to over 11 times in Wisconsin.
Similarly, the ratio of average emergency medicine physician charges to Medicare rates varied from 7.5 times Medicare rates in Texas to only 3.1 in Montana.
The following observations were removed prior to calculations:
- Provider types listed as All Other Suppliers, Ambulatory Surgical Center, Clinical Laboratory, Independent Diagnostic Testing Facility, Mammography Center, Portable X-Ray Supplier, Radiation Therapy Center, Slide Preparation Facility, Undefined Physician type, Unknown Physician Specialty Code, and Unknown Supplier/Provider.
- Ground and air ambulance mileage claims.
The CMS data includes observations aggregated for each provider / billing code combination during a full year. Providers are identified by their national provider identifier (NPI) and billing codes are from the Healthcare Common Procedure Coding System (HCPCS). The average billed charge and average Medicare allowed amount are included for each provider / code combination in each year (that is, these fields represent the average billed charge and Medicare allowed amount for all services matching a given HCPCS code provided to Medicare patients by a given provider in a given year). The provider specialty and address are also provided.
To calculate the 20th and 80th percentiles of physicians by average charge-to-Medicare ratios, we analyze the distribution of charge-to-Medicare ratios for each NPI-HCPCS code combination within a given specialty, weighted by the volume of services provided. The mean charge-to-Medicare allowed amount ratios are calculated by dividing the sum of all submitted charges by the sum of all Medicare allowed amounts for each specialty in each year.
Source: Authors’ analysis of Medicare Provider Utilization and Payment Data: Physician and Other Supplier Public Use Files. Means were computed across physicians and services, weighting by the number of services rendered.
You must be logged in to post a comment.